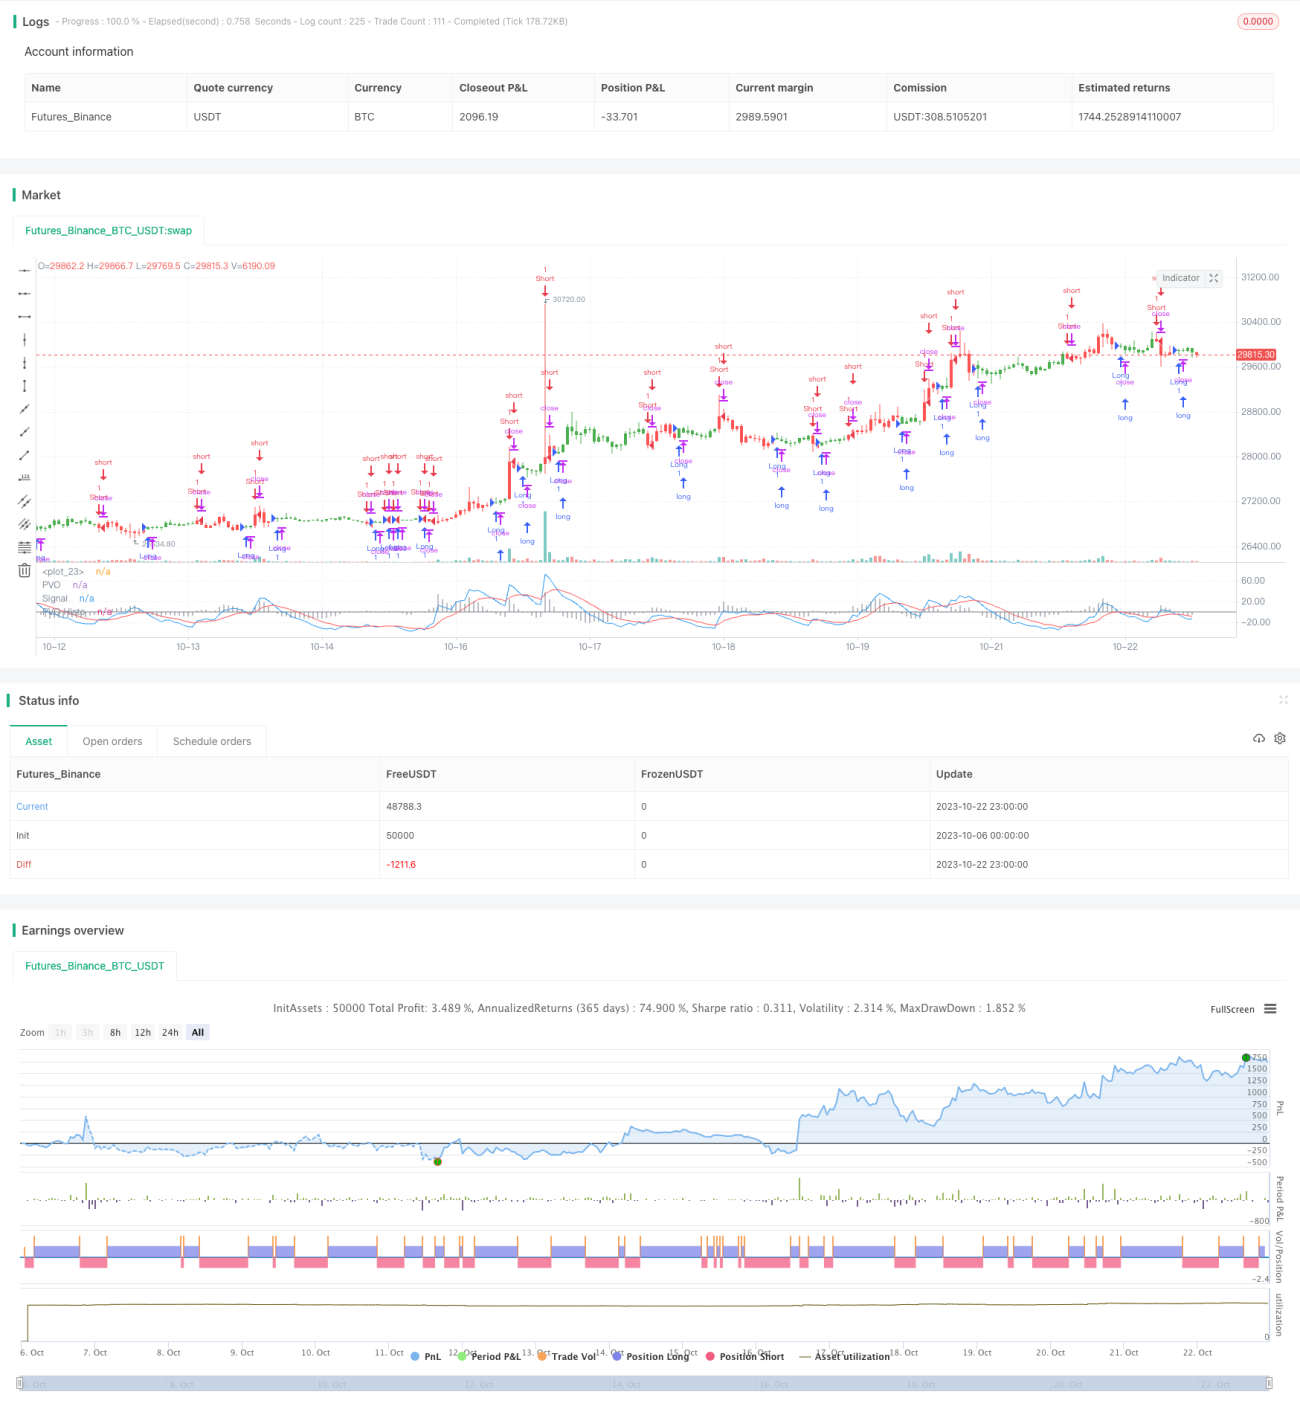
Percentage Volume Oscillator Strategy

Author: ChaoZhang, Date: 2023-11-06 15:45:02
Tags:

img

Overview:

The Percentage Volume Oscillator (PVO) is a momentum oscillator for volume. PVO measures the difference between two volume-based moving averages as a percentage of the larger moving average to gauge shifts in volume trends. This strategy uses PVO to identify volume trends to confirm or refute price action. Typically, a breakout or support break is validated when PVO is rising or positive.

Strategy Logic:

  1. Calculate short period volume EMA (default 12 days)
  2. Calculate long period volume EMA (default 26 days)
  3. Calculate PVO as the percentage difference between short and long EMA
  4. Calculate signal line EMA on PVO (default 9 days)
  5. Calculate histogram as difference between PVO and signal line
  6. Go short when signal line crosses above PVO, go long when crosses below
  7. Option to reverse trade direction
  8. Color bars based on signal

The strategy forms PVO indicator through double EMA composition and uses signal line to identify volume trend changes to anticipate potential price direction. Unlike regular double EMA, PVO focuses more on volume percentage difference for clearer judgement of volume increase/decrease.

Advantages:

  1. Utilize volume changes to determine future price trends as early warning
  2. Simple and practical double EMA structure with flexible parameter tuning
  3. Visualized color bars for intuitive trend judgement and easy operation
  4. Signal line reduces false signals and improves stability
  5. Optional reverse trading enriches strategy usage
  6. Applicable for mid-to-long term trends and short term trading

The strategy fully utilizes the indicative effect of volume changes on price action. Compared to single indicator, the PVO structure is more stable with customizable parameters to judge volume trend changes and detect potential price direction in advance. The intuitive color differentiation strengthens trend decision and reverse trading option makes it a versatile volume based strategy.

Risks:

  1. Volume indicator lags price signal and may diverge
  2. Improper EMA parameter setting may misjudge market state
  3. Reverse trading needs caution, can increase loss
  4. Volume change alone cannot determine specific entry point
  5. Volume does not fully predict price, needs combining with other indicators

Volume change often lags price action and PVO may give wrong signal when price approaches trend end. Wrong parameter settings can also affect judgement accuracy. Caution is needed when reverse trading, as trend may extend. Volume alone cannot determine precise entry point and needs aid of other indicators for timing. Volume does not fully predict price and needs prudent following.

Optimization:

  1. Optimize EMA periods for different products and timeframes
  2. Add filter conditions to avoid invalid signals
  3. Combine other indicators to confirm entry timing
  4. Add stop loss

Testing and optimizing EMA combinations to find best periods for trend detection. Adding volume fluctuation threshold to filter ineffective signals. Incorporating MACD, KD for further entry confirmation. Setting stop loss to control single trade loss. These will greatly improve strategy applicability.

Conclusion:

The Percentage Volume Oscillator strategy judges volume trend changes by calculating the percentage difference between volume EMAs to anticipate potential price direction. It adopts simple and effective double EMA structure to measure volume fluctuations and uses intuitive color coding to enhance visual effect. The flexible reverse trading option and parameter settings make it suitable for both mid-to-long term and short term trading. But as volume indicator lags price signal and cannot determine precise entry timing, parameters and incorporation of other indicators need optimization to improve strategy performance.


/*backtest
start: 2023-10-06 00:00:00
end: 2023-10-23 00:00:00
period: 1h
basePeriod: 15m
exchanges: [{"eid":"Futures_Binance","currency":"BTC_USDT"}]
*/

//@version=2
////////////////////////////////////////////////////////////
//  Copyright by HPotter v1.0 27/09/2017
// The Percentage Volume Oscillator (PVO) is a momentum oscillator for volume. 
// PVO measures the difference between two volume-based moving averages as a 
// percentage of the larger moving average. As with MACD and the Percentage Price 
// Oscillator (PPO), it is shown with a signal line, a histogram and a centerline. 
// PVO is positive when the shorter volume EMA is above the longer volume EMA and 
// negative when the shorter volume EMA is below. This indicator can be used to define 
// the ups and downs for volume, which can then be use to confirm or refute other signals. 
// Typically, a breakout or support break is validated when PVO is rising or positive. 
//
// You can change long to short in the Input Settings
// WARNING:
// - For purpose educate only
// - This script to change bars colors.
////////////////////////////////////////////////////////////
strategy(title="Percentage Volume Oscillator (PVO)", shorttitle="PVO")
LengthShortEMA = input(12, minval=1)
LengthLongEMA = input(26, minval=1)
LengthSignalEMA = input(9, minval=1)
reverse = input(false, title="Trade reverse")
hline(0, color=gray, linestyle=line)
xShortEMA = ema(volume , LengthShortEMA)
xLongEMA = ema(volume , LengthLongEMA)
xPVO = ((xShortEMA - xLongEMA) / xLongEMA) * 100
xSignalEMA = ema(xPVO , LengthSignalEMA)
xPVOHisto = xPVO - xSignalEMA
pos = iff(xSignalEMA < xPVO, -1,
	   iff(xSignalEMA > xPVO, 1, nz(pos[1], 0))) 
possig = iff(reverse and pos == 1, -1,
          iff(reverse and pos == -1, 1, pos))	   
if (possig == 1) 
    strategy.entry("Long", strategy.long)
if (possig == -1)
    strategy.entry("Short", strategy.short)	   	    
barcolor(possig == -1 ? red: possig == 1 ? green : blue ) 
plot(xPVO, color=blue, title="PVO")
plot(xSignalEMA, color=red, title="Signal")
plot(xPVOHisto, color=gray, title="PVO Histo", style=histogram)

More