Bi-Polar Monthly Return Strategy

1
Follow
1777
Followers
##Overview
This strategy uses pivot points to identify trend reversals and take long/short positions accordingly. It locks in monthly profits to prevent large drawdowns during losing periods.
##How It Works
- Uses
pivothigh()andpivotlow()to calculate pivot points, which indicate trend reversals. - Goes long when price breaks above pivot high. Goes short when price breaks below pivot low.
- Calculates monthly return at start of each month and saves to array.
- Calculates yearly return at start of each year and saves to array.
- Draws table of returns for intuitive view of monthly and yearly performance.
##Advantage Analysis
- Pivot points filter out some false reversal signals.
- Locking monthly profits reduces losing months' impact - bi-polar returns.
- Return table shows performance trends clearly.
##Risk Analysis
- Pivots may change, causing wrong reversal entries. Can optimize params or add filters.
- Forced monthly close misses further profits. Consider partial position closure.
- Table lacks max drawdown and risk metrics. Add more metrics.
##Optimization Directions
- Add filters near pivots to avoid frequent invalid reversals.
- Close partial instead of full position to reduce missed opportunities.
- Add quantitative risk metrics like max drawdown, Sharpe ratio.
##Summary
This strategy trades reversals at pivot points and locks monthly profits to control drawdowns. But some parameters and logic can be improved for more accurate signals and robust risk management. The intuitive return table aids analysis. Overall, this strategy has merit but requires prudent evaluation for live trading.
Source
Pine
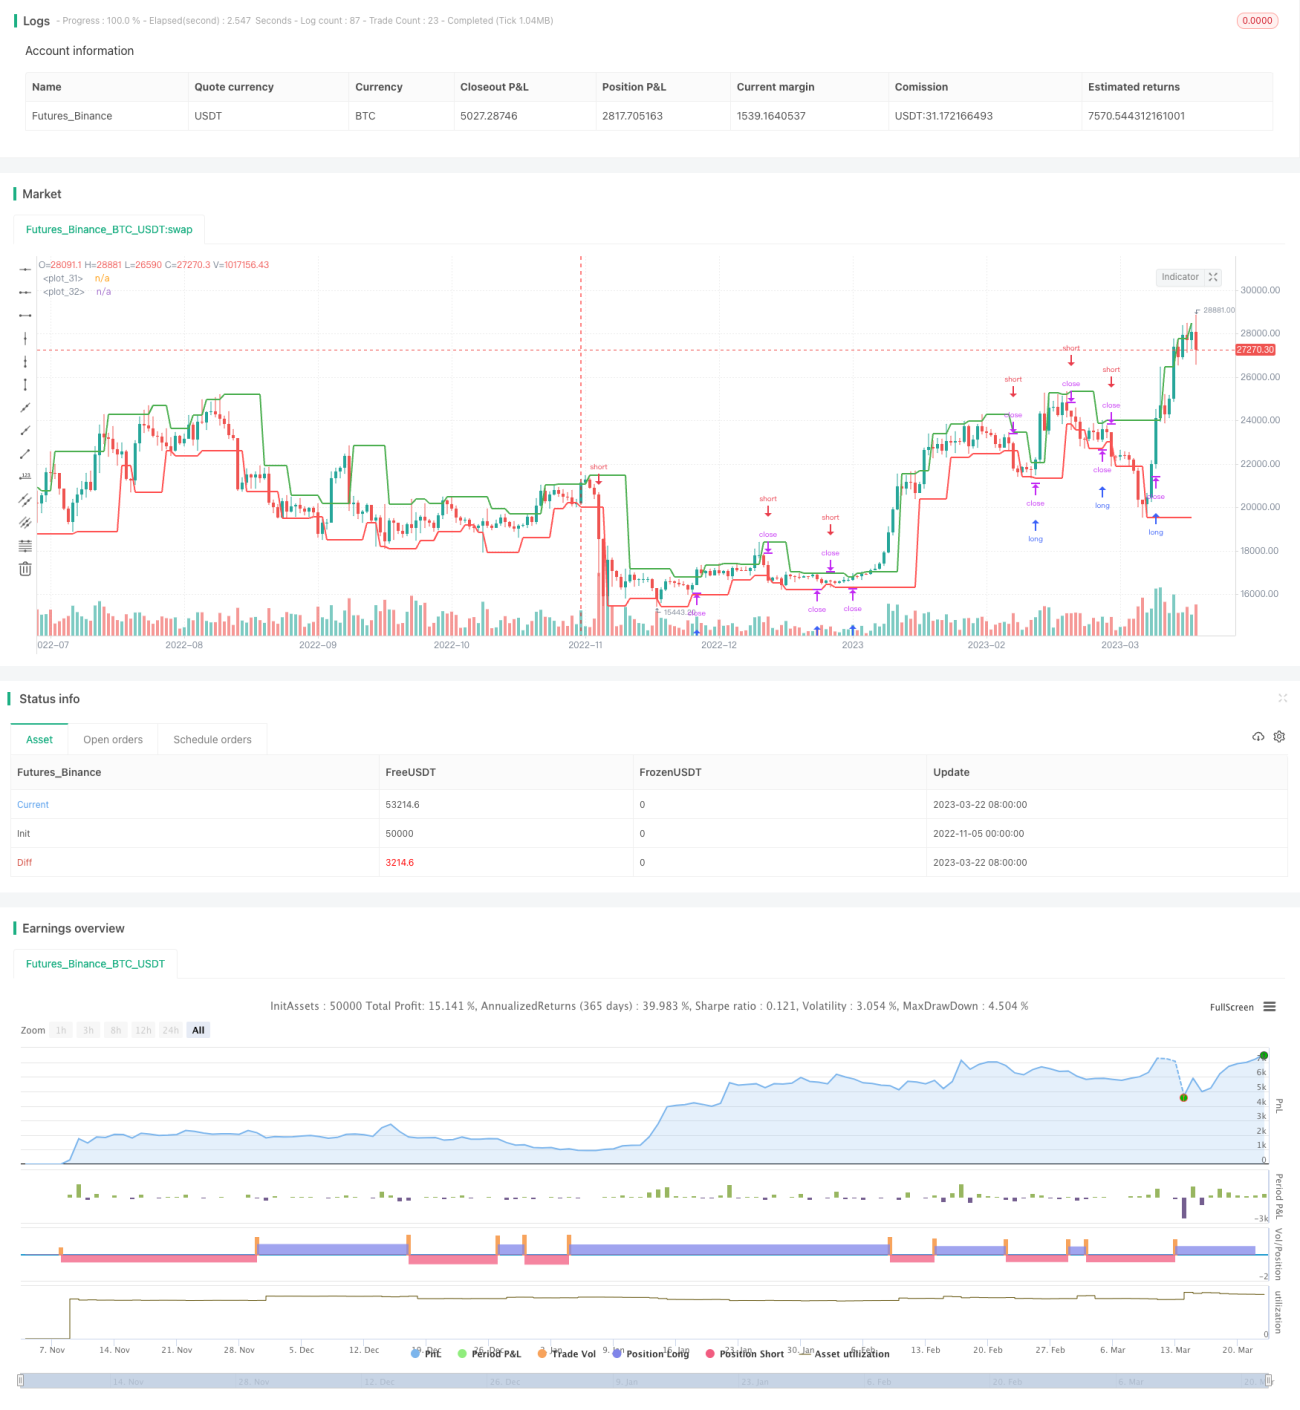
/*backtest
start: 2022-11-05 00:00:00
end: 2023-03-23 05:20:00
period: 1d
basePeriod: 1h
exchanges: [{"eid":"Futures_Binance","currency":"BTC_USDT"}]
*/

//@version=4
strategy("Monthly Returns in PineScript Strategies", overlay = true, default_qty_type = strategy.percent_of_equity, default_qty_value = 25, calc_on_every_tick = true, commission_type = strategy.commission.percent, commission_value = 0.1)

// Inputs Strategy parameters
Related strategies
Comment
All comments (0)
No data
- 1