Super Ichi Strategy

Overview
The Super Ichi strategy is a trend trading strategy that makes trading decisions based on the Super Ichi indicator. It uses the relationships between the Tenkan line, Kijun line and the Ichimoku Cloud of the Super Ichi indicator to determine the current trend direction, and enters on price pullbacks.
The Super Ichi strategy is mainly suitable for medium-to-long term trend trading and aims to profit from major trends. It also has strong trend identification capabilities.
Strategy Logic
The Super Ichi strategy mainly judges the following elements to determine the trading direction:
-
Tenkan and Kijun Relationship: Bullish when Tenkan is on top, bearish when below
-
Cloud Color: Bullish when cloud is green, bearish when red
-
Price Pullback: Requires a pullback from the lines before entry
Specifically, the trading signals are:
Long Signal:
- Tenkan above Kijun
- Price above Tenkan and Kijun
- Tenkan and Kijun above Cloud
- Price pulls back below Tenkan and Kijun
Short Signal:
- Tenkan below Kijun
- Price below Tenkan and Kijun
- Tenkan and Kijun below Cloud
- Price pulls back above Tenkan and Kijun
When the long/short signal is triggered, a position will be opened based on the current position.
Advantage Analysis
The Super Ichi strategy has the following advantages:
-
Uses Ichimoku combination to determine trends accurately
-
Tenkan/Kijun shows short-term, Cloud shows long-term trends
-
Pullback requirement avoids false breakouts
-
Risk management uses recent swing high/low for stop loss to limit losses
-
Reasonable risk-reward ratio for steady gains
-
Applicable to different timeframes for medium-to-long term trend trading
-
Clear logic and large optimization space
-
Performs well across various market conditions
Risk Analysis
The Super Ichi strategy also has the following risks:
-
Stop loss may be triggered frequently during ranging markets, impacting profitability
-
Failure to quickly reverse positions when trend changes swiftly could lead to losses
-
Default risk-reward ratios may not suit all instruments, fine tuning required
-
Limited upside potential when Cloud breakout has limited follow-through
-
Indicator parameters need extensive testing and optimization for active instruments
Risks can be reduced through:
-
Optimizing parameters for different timeframes and instruments
-
Adding filters to avoid false breakout entries during ranging market
-
Using dynamic stop loss to reduce being stopped out
-
Testing different risk-reward ratio settings
-
Confirming signal strength using chart patterns etc.
Optimization Directions
The Super Ichi strategy can be optimized in the following aspects:
-
Optimize Tenkan/Kijun parameters to better suit the traded instrument
-
Optimize Cloud parameters for better long-term trend assessment
-
Enhance stop loss algorithm, e.g. ATR-based or trailing stops
-
Add filters using other indicators to reduce false entries
-
Fine-tune risk-reward ratios for different instruments and timeframes
-
Use martingale position sizing to accommodate varying market volatility
-
Utilize machine learning for parameter optimization and robustness
-
Set separate parameters for day vs overnight sessions
Summary
The Super Ichi strategy is well-suited for medium-to-long term trend trading overall. It excels at determining trend direction using Ichimoku, while the pullback requirement avoids false entries. With parameter optimization, it can achieve steady profits across more instruments and timeframes. Easy to understand yet highly optimizable, the Super Ichi strategy serves as an excellent basic trend following strategy for research and learning.
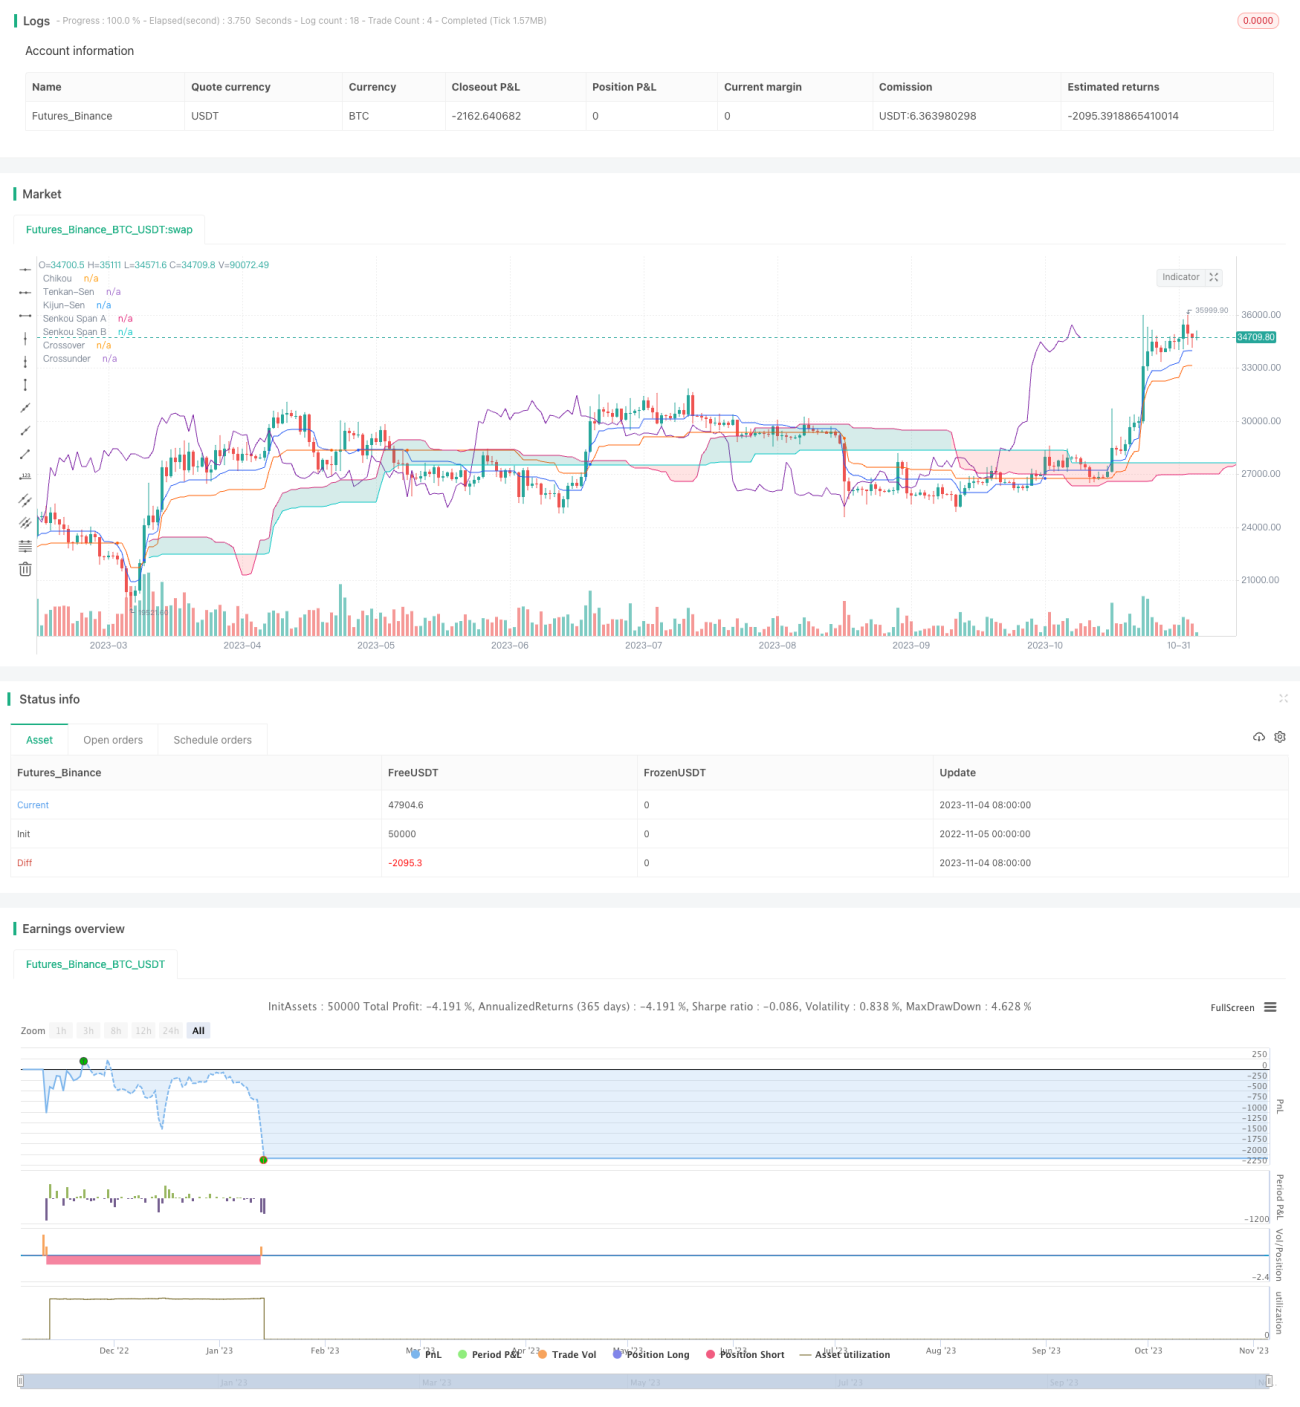
/*backtest
start: 2022-11-05 00:00:00
end: 2023-11-05 00:00:00
period: 1d
basePeriod: 1h
exchanges: [{"eid":"Futures_Binance","currency":"BTC_USDT"}]
*/

// Strategy based on the the SuperIchi indicator.
//
// Strategy was designed for the purpose of back testing.
// See strategy documentation for info on trade entry logic.- 1