Bollinger Band Breakout Strategy

Overview
This strategy uses Bollinger Bands to gauge market trend and combines bandwidth signal to identify trading opportunities, aiming for steady growth of the investment portfolio. Backtested with previous year's data, it achieved 78.95% profitability with maximum drawdown of only -4.02%. This is one of my series of automated strategies that helps grow my portfolio steadily.
Feel free to tweak parameters and backtest this strategy. Any comments or ideas are appreciated.
If you are happy with the existing results and would like to automate this strategy, which can be done via alerts, you need to convert it to a study and add alerts in the code. Let me know if you are interested in that and I can create a study based on this strategy.
Strategy Logic
This strategy uses Bollinger Bands and bandwidth to determine entries and exits.
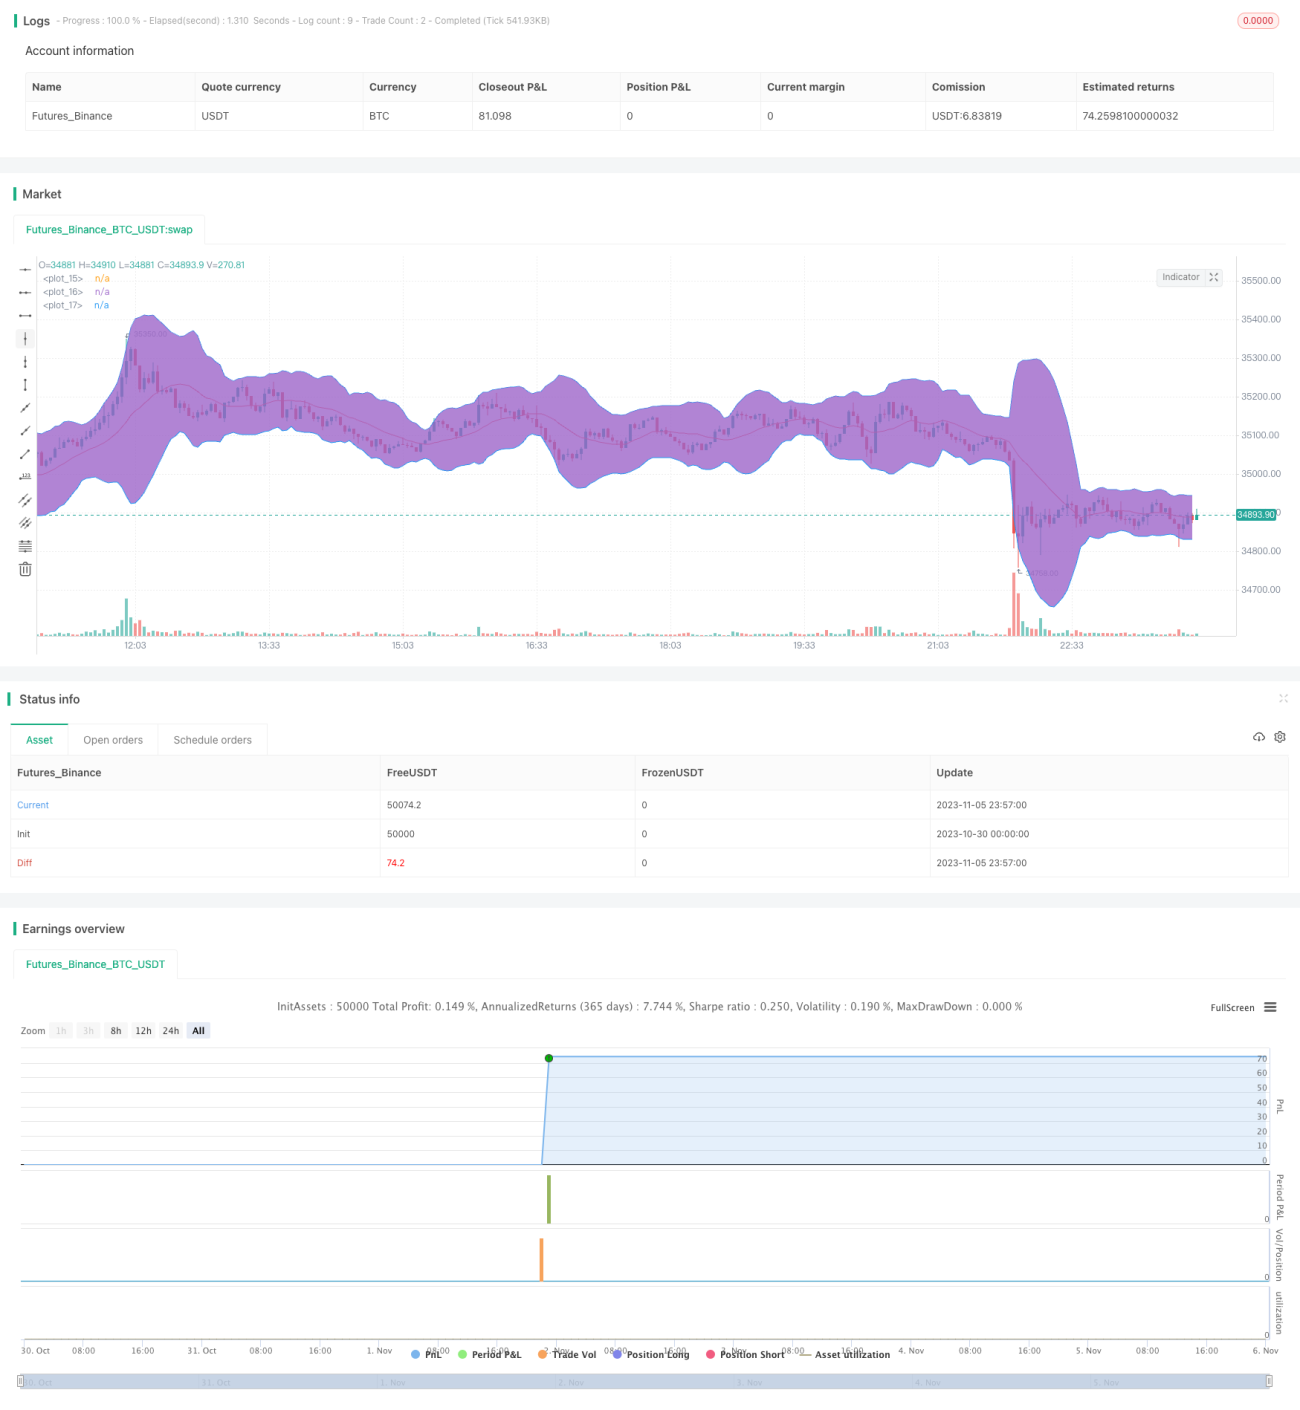
Bollinger Bands include upper band, middle band and lower band. The middle band is a n-period simple moving average, default n = 16. The upper band is middle band + k * standard deviation, lower band is middle band - k * standard deviation, default k = 3. When price approaches upper band, it indicates overvaluation or overbought. When price approaches lower band, it indicates undervaluation or oversold.
Bandwidth indicator shows the volatility of price relative to the middle band. It is calculated by (upper band - lower band)/middle band * 1000. When bandwidth is below 20, it indicates low volatility or consolidation. When bandwidth exceeds 50, it represents increased volatility.
This strategy looks for long opportunities when bandwidth is between 20-50 and price breaks below lower band. After going long, take profit is set at 108% of entry price, or a stop loss exit when price breaks above upper band.
Advantage Analysis
The advantages of this strategy include:
-
Bollinger Bands gauge trend direction, reducing risks from false breakouts
-
Bandwidth signal accurately locates range-bound action, avoiding large losses from big swings
-
Backtest shows nearly 80% profitability over 1 year, extremely high risk-reward ratio
-
Maximum drawdown under 5%, effectively controls risk and maintains steady portfolio growth
-
Simple and clear logic, easy to understand and implement, widely applicable to various assets
Risk Analysis
The risks of this strategy include:
-
Poor Bollinger parameter settings may miss good trading opportunities
-
Low trading frequency during persistent bull or bear markets, profitability constrained
-
Insufficient backtest data, actual performance may differ from backtest
-
Stop loss may be taken out during extreme moves, leading to large losses
-
High transaction costs also reduce actual profits
Solutions:
-
Optimize parameters and adjust Bollinger period based on market
-
Introduce additional indicators to handle abnormal market conditions
-
Gather sufficient data and backtest across various markets to verify stability
-
Adjust stop loss appropriately to prevent large losses from extreme moves
-
Select trading platforms with low commissions to reduce transaction costs
Optimization Directions
This strategy can be improved in the following aspects:
-
Add volume confirmation to avoid false breakouts
-
Combine with trend indicators to identify trend direction
-
Use machine learning to auto tune parameters and adapt to market
-
Add correlation filter to avoid trading uncorrelated assets
-
Optimize take profit/stop loss for more gains during uptrends
-
Introduce more condition filters to increase win rate
-
Test multi-timeframe combinations to profit from multiple cycles
-
Build indexed portfolio to expand exposure
-
Use machine learning to auto generate & validate new strategies
Conclusion
Overall this Bollinger Band breakout strategy backtested well and can produce steady returns in range-bound markets. The core logic is simple and clear, easy to grasp and apply. But further improvements in parameter optimization, risk control and portfolio management are needed for stable profits in complex markets. This is a basic trend-following strategy, and can be enhanced by introducing more technical indicators and risk management mechanisms, or combined with machine learning for automation. In summary, this strategy opens the door to algorithmic trading for beginners, and also provides possibilities for experienced traders to optimize strategies.
- 1