Dual Stochastics Strategy

Overview
The Dual Stochastics strategy judges bullish and bearish zones by calculating stochastic indicators of the current period and multiple timeframes, aiming to buy low and sell high. It computes stochastic indices of both the current period and 3 times the period, and generates trading signals based on crossovers of the different timeframe indicators to track trends.
Strategy Logic
The strategy calculates two sets of stochastic indicators simultaneously. The first set is the stochastics of the current period, namely the K and D values. The second set is the stochastics of 3 times the current period, namely MTFK and MTFD.
When MTFK crosses above 50 and current K is greater than D, a buy signal is generated, indicating a bullish zone to go long. When MTFD crosses below 50 and current K is less than D, a sell signal is generated, indicating a bearish zone to go short.
Therefore, the strategy uses dual stochastic indicators to judge bullish and bearish zones and track price trends. It goes long in bullish zones and goes short in bearish zones, achieving the goal of buying low and selling high.
Specifically, the long entry logic is:
longCondition = crossover(mtfK, 50) and k>50 and k>d and mtfK>mtfD
The short entry logic is:
shortCondition = crossunder(mtfD, 50) and k<50 and k<d and mtfK<mtfD
Where mtfK is the K value of the 3x period, and mtfD is the D value of the 3x period. Long signals are generated when mtfK crosses above 50 and k>d. Short signals are generated when mtfD crosses below 50 and k<d.
The strategy also sets stop loss logic. When long, if mtfD crosses below the upper band, a close signal is generated. When short, if mtfK crosses above the lower band, a close signal is triggered.
Advantage Analysis
The advantages of this strategy are:
-
Using dual stochastics provides more accurate judgment of bullish and bearish zones. The current period indicator judges short-term trends while the larger period indicator judges long-term trends. Combining the two can better capture trends.
-
Trading based on crossovers of different timeframe indicators can effectively track trends and achieve buying low and selling high.
-
The stop loss logic helps control risks and limit losses to some extent.
-
The strategy logic is simple and clear, easy to understand and implement for live trading.
Risk Analysis
The strategy also has some risks:
-
Dual stochastics may generate false signals, causing unnecessary trades. For example, divergences between short-term and long-term trends caused by sudden events.
-
Improper stop loss settings may lead to enlarged losses. Reasonable stop loss distances should be set to avoid being trapped.
-
Frequent trading generated by the strategy may negatively impact profits due to commissions. Parameters should be adjusted to reduce unnecessary trades.
-
The strategy relies solely on technical indicators without considering fundamentals, which should be monitored to some degree.
Solutions:
-
Adjust parameters of the dual stochastics to reduce false signals.
-
Optimize the stop loss logic and set reasonable stop loss distances.
-
Adjust parameters to reduce trading frequency. Relax crossover criteria for example.
-
Pay attention to significant fundamental events to avoid subjective trading.
Optimization Directions
The strategy can be optimized in the following aspects:
-
Optimize the parameters of the dual stochastics to reduce false signals. Test the effects of different K and D values.
-
Incorporate other indicators to filter signals, such as MACD, moving averages etc, avoiding false signals.
-
Optimize the stop loss strategy by testing different stop loss points and ratios to effectively control risks.
-
Incorporate trading volume indicators, such as volume breakouts, to avoid ineffective trades during price consolidations.
-
Test different holding periods. Too short holding periods lead to commissions eating up profits, too long fails to stop loss in time.
-
Incorporate fundamental factors, closing positions around significant events to avoid being shocked.
Summary
The Dual Stochastics strategy judges bullish and bearish zones by current period and multiple period stochastic indicators, achieving the goal of buying low and selling high. It has advantages like strong trend tracking capability, simple logic, and easy live trading. But risks exist, requiring parameter tuning, stop loss optimization, and incorporation of other technicals or fundamentals to improve. If comprehensively optimized and strictly backtested, this strategy can become a very practical trend following system.
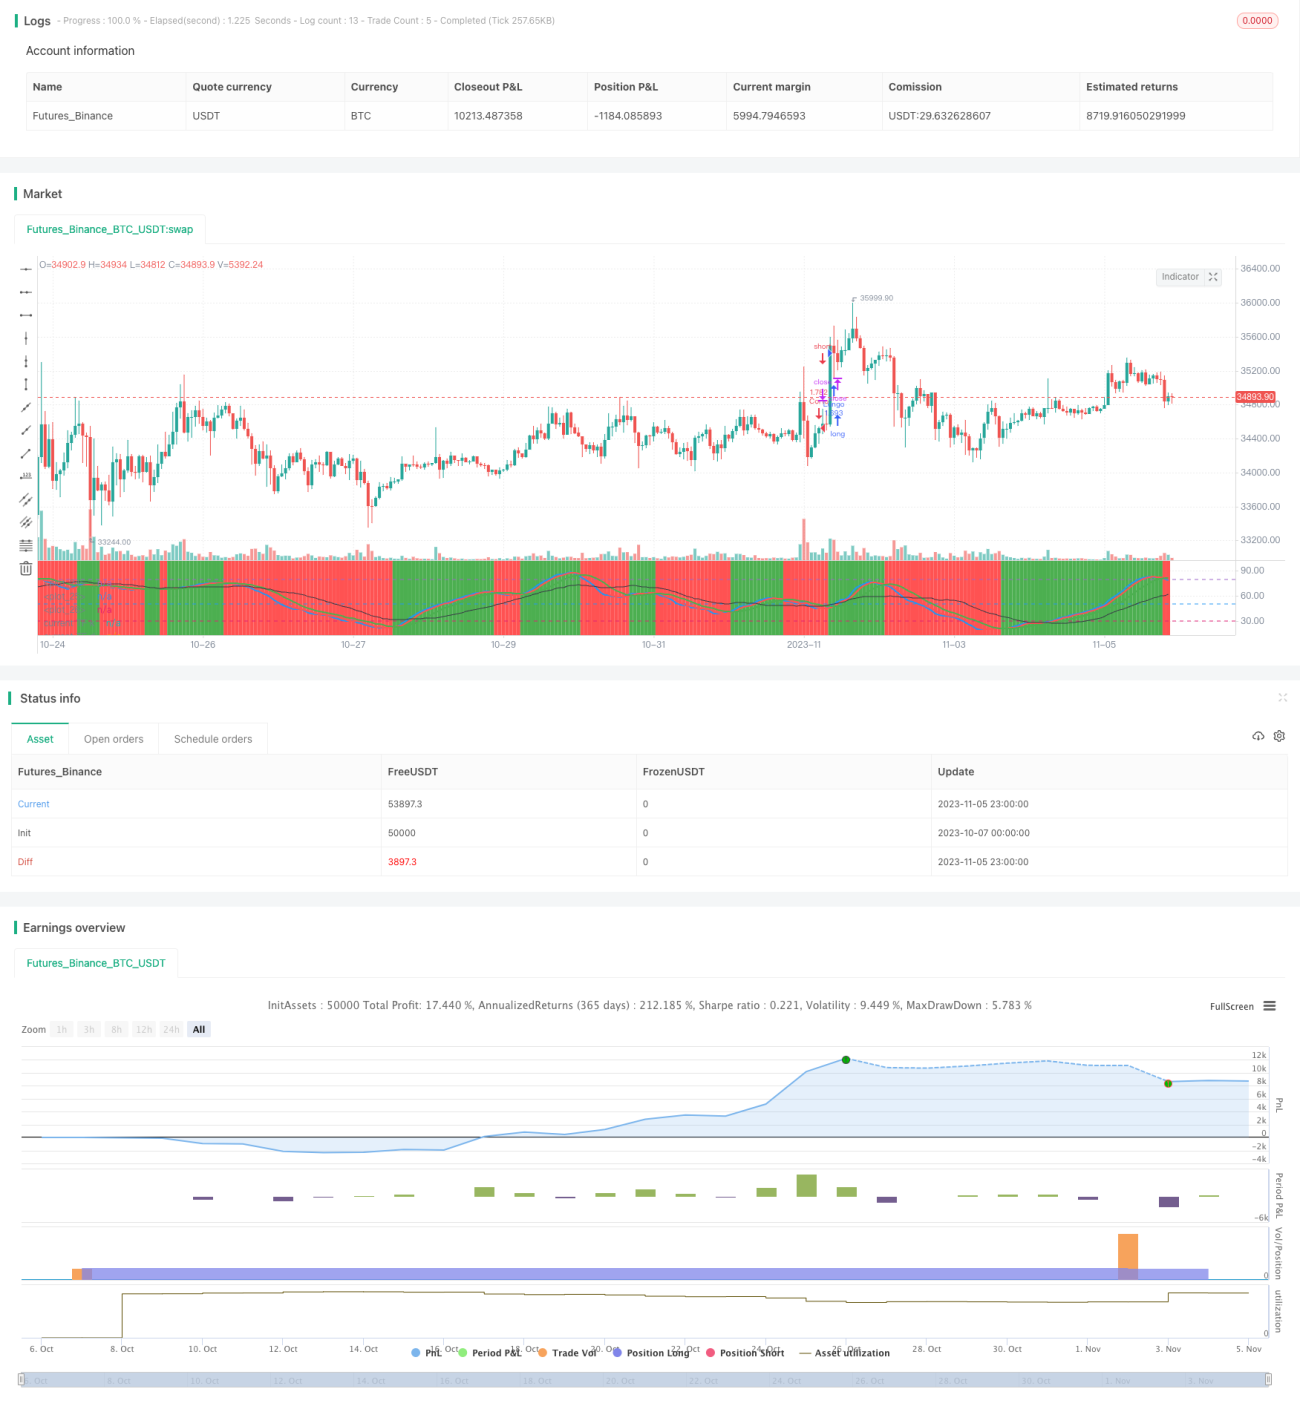
/*backtest
start: 2023-10-07 00:00:00
end: 2023-11-06 00:00:00
period: 1h
basePeriod: 15m
exchanges: [{"eid":"Futures_Binance","currency":"BTC_USDT"}]
*/

//@version=3
strategy("stoch startegy", overlay=false,default_qty_type=strategy.percent_of_equity,default_qty_value=100,currency=currency.USD)

len = input(54, minval=1, title="Length for Main Stochastic") - 1