RSI Moving Average Crossover Strategy

Overview
The RSI Moving Average Crossover Strategy is a strategy that is mostly used for cryptocurrency trading. It applies a moving average to the RSI indicator and trades based on the crossovers between the RSI and its moving average. It also includes the indicator that it is made from.
Strategy Logic
The strategy first calculates the RSI indicator. The RSI indicator reflects the strength of price based on the upward and downward movements over a certain period of time. RSI above 70 is considered overbought, and below 30 oversold.
Then, the strategy applies a moving average to the RSI indicator. The moving average can filter out random fluctuations and determine the trend direction. Here a 10-period RSI moving average is set.
When the RSI crosses above its moving average, it is considered a buy signal. When the RSI crosses below its moving average, it is considered a sell signal. Trading is conducted according to these two signals.
In the code, the RSI indicator with length period is calculated first. Then the 10-period moving average ma of RSI is calculated. When ma crosses above rsi, it will buy. When ma crosses below rsi, it will sell.
In addition, the code plots the line chart for rsi and ma, as well as the column chart for rsi-ma. The dividing lines for rsi=70 and rsi=30 are also plotted. The corresponding signal arrows are marked on the chart when buying or selling.
Advantage Analysis
-
RSI can judge overbought and oversold conditions. Moving average can filter out random fluctuations. The combination of the two can identify trend reversal points.
-
RSI moving average crossover is a relatively mature trading strategy idea that can filter out some false signals.
-
The strategy code is simple and clear, easy to understand. The plotting function is complete for clearly observing trading signals.
-
This strategy works well for cryptocurrencies with relatively obvious trends.
Risk Analysis
-
Improper RSI and moving average period parameters may generate too many wrong signals.
-
Relying solely on indicator crossovers cannot completely avoid being trapped. Trend analysis needs to be combined.
-
Trading costs can have some impact on profits. Position sizing needs to be optimized.
-
High volatility of crypto market. Need to be alert to stop loss risks.
To address the risks, parameters can be adjusted to optimize the indicators, position sizes can be reduced, stop loss can be set, and trend analysis can be used to filter signals.
Optimization Directions
-
Research the optimal combination of RSI and moving average under different period parameters.
-
Increase position size when the trend is strong, and reduce when trend is unclear.
-
Set dynamic stop loss to trail the trend.
-
Explore combining RSI with other indicators to form new trading signals.
-
Explore machine learning models based on this strategy to improve win rate.
Summary
The RSI moving average crossover strategy combines the advantages of trend and filtering indicators, relatively mature and reliable. The strategy logic is simple and clear, and the code implementation is also quite complete. Overall it is a pretty good cryptocurrency trading strategy. But every strategy needs optimization. It requires constant testing and adjustment, combined with trend analysis, in order to achieve better strategy performance.
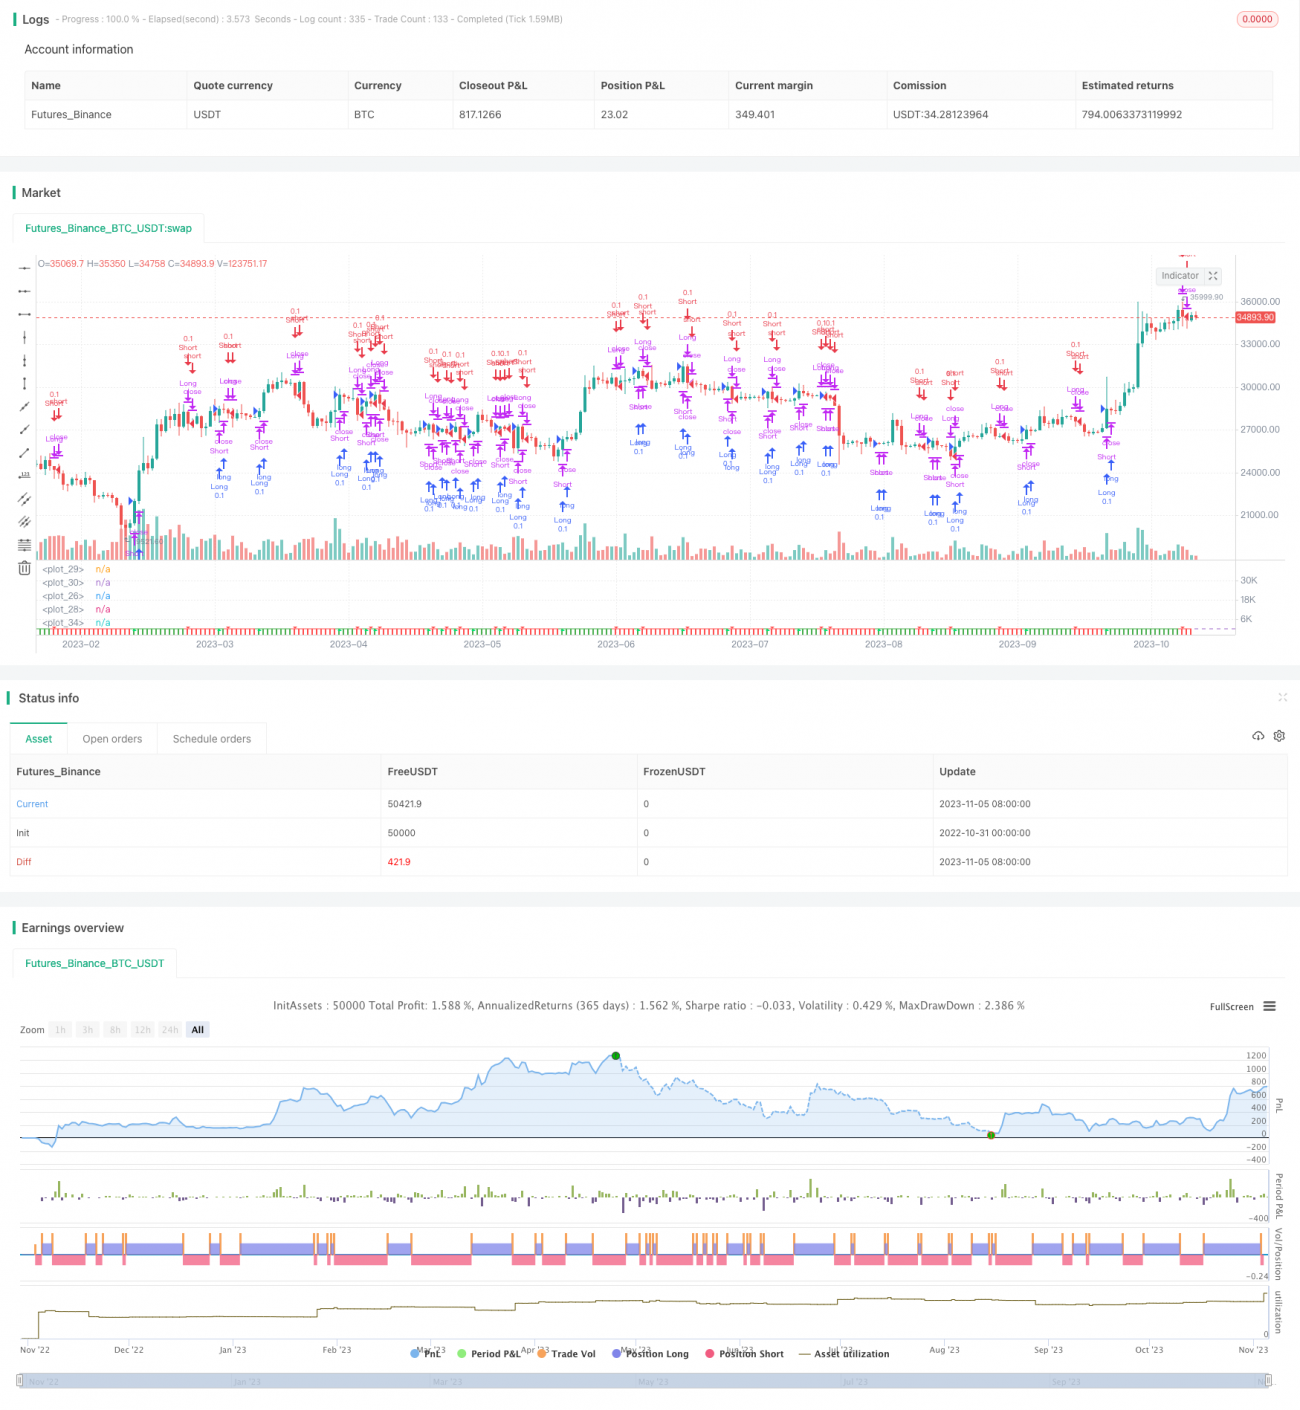
/*backtest
start: 2022-10-31 00:00:00
end: 2023-11-06 00:00:00
period: 1d
basePeriod: 1h
exchanges: [{"eid":"Futures_Binance","currency":"BTC_USDT"}]
*/

//@version=4
strategy("RSI w MA Strategy", shorttitle="RSI w MA Strategy", overlay=false, initial_capital=10000, currency='USD',process_orders_on_close=true)

//TIME FRAME AND BACKGROUND CONTROL/////////////////////////////////////////////- 1