Moving Average Crossover Strategy

Overview
The moving average crossover strategy is a very classic technical analysis strategy. It calculates moving averages of different periods and observes their crossover to determine the trend of the market, in order to achieve the goal of buying low and selling high. This strategy is suitable for medium and long term trading, and can effectively filter market noise and identify trends.
Principle
This strategy mainly calculates the 10-day simple moving average (SMA) and the 10-day triangular moving average (TRIMA). When the SMA crosses above the TRIMA, a buy signal is generated, indicating the market trend has changed from decline to rise, and we can buy. When the SMA crosses below the TRIMA, a sell signal is generated, indicating the market trend has changed from rise to decline, and we can sell.
Specifically, the strategy first inputs the closing price, and defines the cycle lengths for calculating SMA and TRIMA. The calculation formula for SMA is:
SMA = (P1 + P2 + ... + Pn) / n
Where Pn is the closing price for the past n days.
The calculation formula for TRIMA is:
TRIMA = (SMA1 + SMA2 + SMA3) / 3
Where SMA1, SMA2, SMA3 are the SMAs of the closing prices for the past n days respectively.
So TRIMA is actually an SMA calculated on top of the SMA, which has a better smoothing effect. When the short-term SMA crosses above the long-term TRIMA, it indicates a breakthrough of the short-term moving average, and we can buy. On the contrary, when the SMA crosses below the TRIMA, it indicates a breakdown below the short-term moving average, and we can sell.
Advantages
The biggest advantage of this strategy is that it utilizes the trend judging capability of moving averages to effectively identify market trends and filter out short-term market noise, in order to buy low and sell high. Compared with a single moving average, the combination of SMA and TRIMA can improve the reliability of breakthroughs and reduce the probability of false breakthroughs. In addition, the moving average itself has good smoothness, which can also play the role of stop loss to reduce the probability of single stop loss. In general, this strategy is very suitable for medium and long term position trading.
Risks
The main risk of this strategy is that the moving average itself lags behind price changes, which may miss the early stage of the trend, resulting in a late entry. In addition, when the market has no obvious trend, this strategy will produce more false breakthroughs. Finally, moving average strategies rely more on parameter optimization. If the parameters are not set properly, it will also greatly affect the strategy.
Optimization Directions
This strategy can be optimized in the following aspects:
-
Optimize the cycle parameters of the moving average to find the best combination scientifically.
-
Add filtering indicators like trading volume to avoid wrong signals when the trading volume is low.
-
Combine trend indicators like MACD to judge local trends and avoid frequent trading in consolidation markets.
-
Adopt adaptive moving averages to dynamically adjust cycle parameters when the market enters specific stages.
-
Verify with multiple time frames, such as considering entry only when both daily and 4-hour lines break through.
Summary
The moving average crossover strategy is a simple and practical technical analysis strategy that is very suitable for medium and long-term position trading. It can effectively identify the trend direction. But it also has certain lagging, and needs to be filtered and optimized with trend judgment indicators to reduce the probability of false signals. If the parameters are optimized properly, it can both protect capital and seize larger trend opportunities. It is definitely worth researching and applying as a strategy idea.
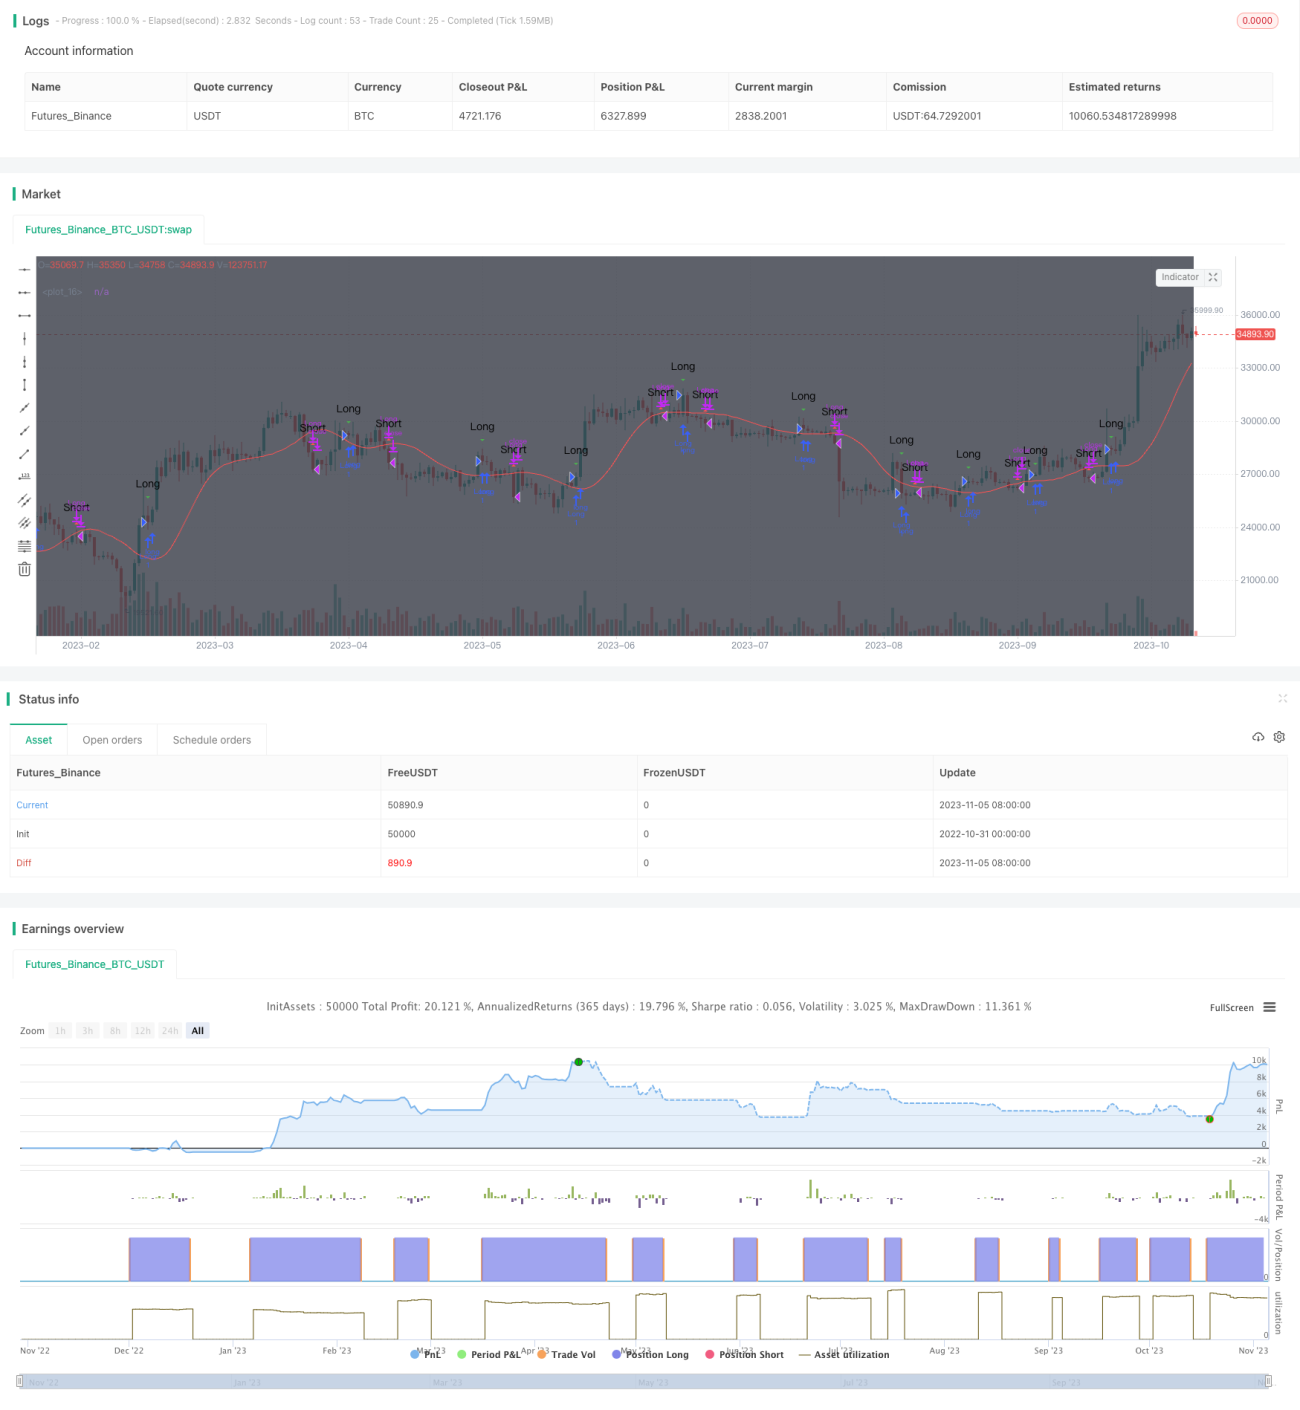
/*backtest
start: 2022-10-31 00:00:00
end: 2023-11-06 00:00:00
period: 1d
basePeriod: 1h
exchanges: [{"eid":"Futures_Binance","currency":"BTC_USDT"}]
*/

//TMA strategy I came across, uses sma to display entry/exit points for both margin and non margin trading. The buy/sell signals as well as syntax are hidden behind comments if you scroll down.
//Change the commented fields for margin or spot trading!
//@version=3
strategy("MP Rollercoaster Strat", overlay=true)- 1