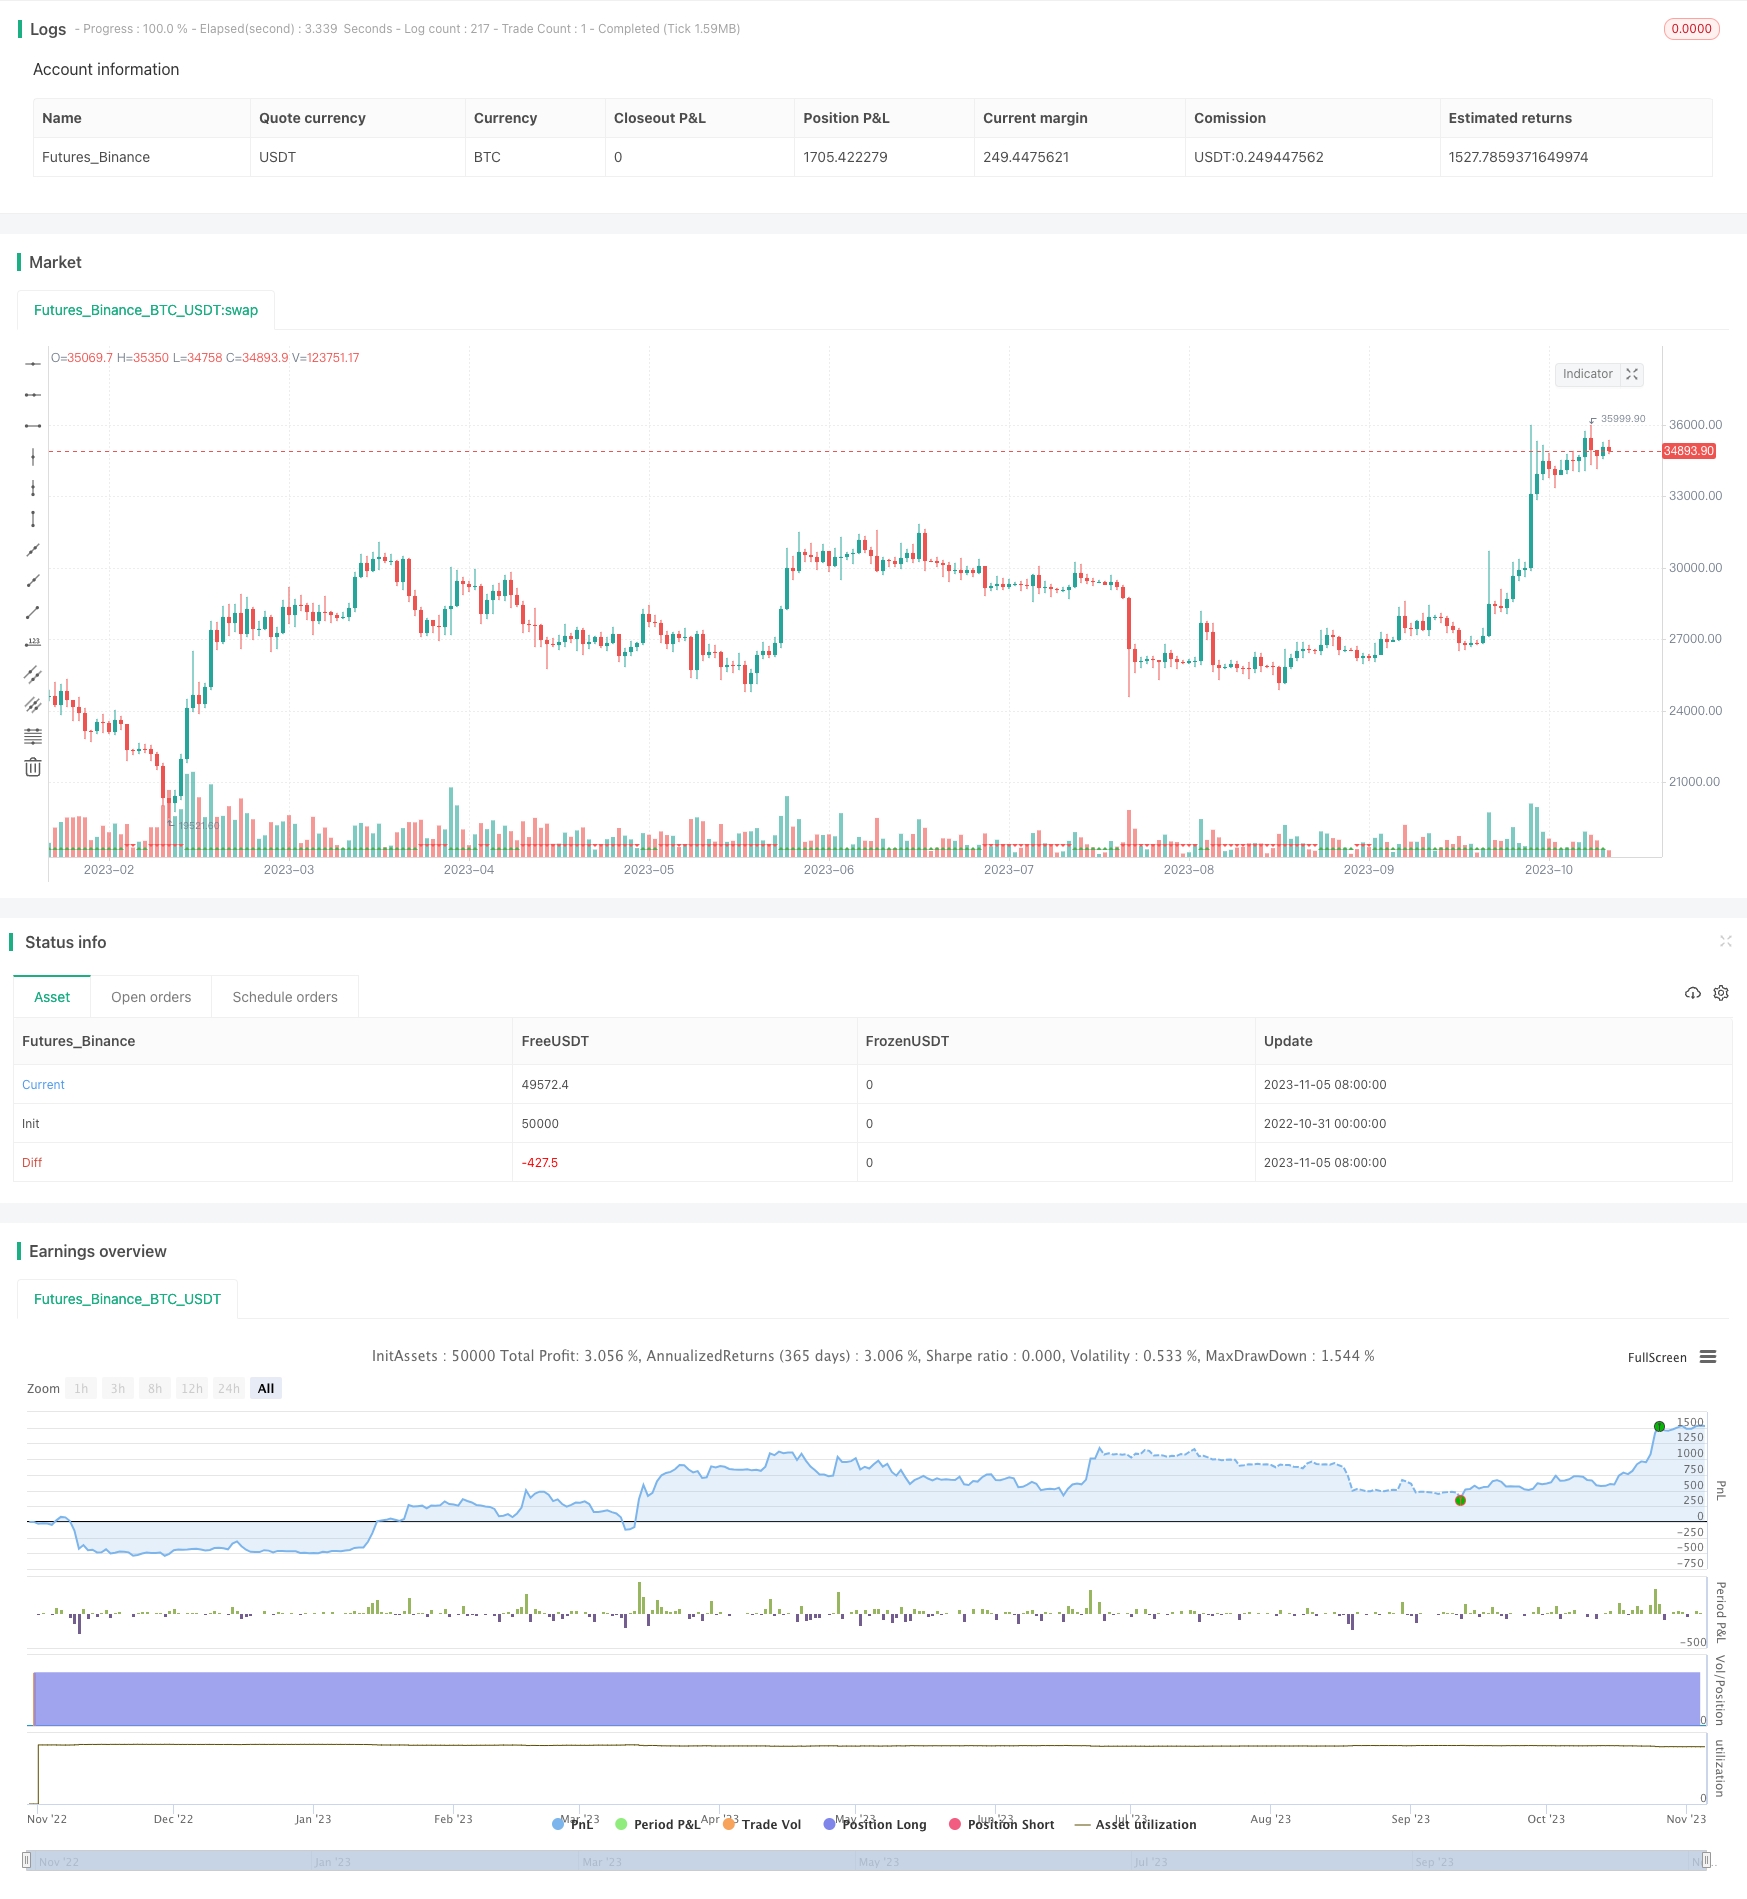
概述
该策略基于平均趋向指标DI+和DI-,利用两个不同时间框架的DI指标判断趋势方向,进而做多做空。当较大时间框架和较小时间框架的DI+均高于DI-时判断为看涨趋势,做多;当两个时间框架DI-均高于DI+时,判断为看跌趋势,做空。
原理
该策略主要基于以下几点原理:
计算DI+和DI-。通过获取高价、收盘价、低价,计算出DI+和DI-。
比较两个时间框架的DI+和DI-。分别在主图的时间框架(如1小时)和较大的时间框架(如日线)计算DI+和DI-,并比较大小关系。
判断趋势方向。当较大时间框架和较小时间框架的DI+均大于DI-时,判断为多头趋势;当两个时间框架的DI-均大于DI+时,判断为空头趋势。
发出交易信号。多头信号为两个时间框架DI+>DI-,做多;空头信号为两个时间框架DI->DI+,做空。
设置止损。基于ATR计算止损位,实现趋势跟踪止损。
退出条件。止损触发或价格反转时平仓。
优势分析
该策略具有以下优势:
使用双时间框架DI判断趋势,可以过滤掉部分假突破。
ATR动态跟踪止损,可以最大限度保护利润,避免止损过小。
及时止损,可以控制单笔止损。
按趋势交易,可以持续捕捉趋势机会。
规则清晰易懂,便于实盘操作。
风险及解决方法
该策略也存在以下风险:
DI指标存在滞后,可能错过入场时机。可以适当优化参数,或结合其他指标判断。
双时间框架判断可能存在上下游分歧。可以增加时间框架验证信号。
止损过于激进可能造成过频交易。可以适当放宽ATR倍数。
震荡行情中可能产生频繁买卖。可以通过增加过滤条件减少交易频率。
参数优化依赖历史数据,实盘可能存在过优化。应谨慎评估参数鲁棒性。
优化方向
该策略可以从以下方面进行优化:
优化DI计算参数,寻找最佳参数组合。
增加其他指标过滤,提高信号准确率。如MACD,KDJ等。
优化止损策略,适应更多市场条件。可改为移动止损或挂单止损。
增加交易时间过滤,避开重要新闻事件。
测试不同品种参数健壮性,提高适应性。
增加机器学习成分,利用历史数据训练判断模型。
总结
该策略整体来说是一个典型的趋势跟踪策略,利用DI指标判断趋势方向,设定止损来锁定盈利,在趋势中持续盈利。该策略优势在于策略思路清晰,易于实盘操作。同时也存在一些改进空间,如优化参数,增加过滤条件等。如果继续优化测试,该策略可以成为一个非常实用的趋势跟踪策略。
/*backtest
start: 2022-10-31 00:00:00
end: 2023-11-06 00:00:00
period: 1d
basePeriod: 1h
exchanges: [{"eid":"Futures_Binance","currency":"BTC_USDT"}]
*/

// This source code is subject to the terms of the Mozilla Public License 2.0 at https://mozilla.org/MPL/2.0/
// © DojiEmoji

//@version=5
strategy("DI+/- multi TF Strat [KL]", overlay=true, pyramiding=1, initial_capital=1000000000, default_qty_type=strategy.percent_of_equity, default_qty_value=5)
var string GROUP_ALERT    = "Alerts"
var string GROUP_SL       = "Stop loss"
var string GROUP_ORDER    = "Order size"
var string GROUP_TP       = "Profit taking"
var string GROUP_HORIZON  = "Time horizon of backtests"
var string GROUP_IND      = "Directional IndicatorDI+ DI-"

// ADX Indicator {
adx_len = input(14, group=GROUP_IND, tooltip="Typically 14")
tf1 = input.timeframe("", title="DI +/- in Timeframe 1", group=GROUP_IND, tooltip="Main: DI+ > DI-")
tf2 = input.timeframe("1D", title="DI +/- in Timeframe 2", group=GROUP_IND, tooltip="Confirmation: DI+ > DI-")
// adx_thres = input(20, group=GROUP_IND)   //threshold not used in this strategy

get_ADX(_high, _close, _low) =>
// (high, close, mid) -> [plus_DM, minus_DM]
    // Based on TradingView user BeikabuOyaji's implementation
    _tr = math.max(math.max(_high - _low, math.abs(_high - nz(_close[1]))), math.abs(_low - nz(_close[1])))
    smooth_tr = 0.0
    smooth_tr := nz(smooth_tr[1]) - nz(smooth_tr[1]) / adx_len + _tr

    smooth_directional_mov_plus = 0.0
    smooth_directional_mov_plus := nz(smooth_directional_mov_plus[1]) - nz(smooth_directional_mov_plus[1]) / adx_len + (_high - nz(_high[1]) > nz(_low[1]) - _low ? math.max(_high - nz(_high[1]), 0) : 0)

    smooth_directional_mov_minus = 0.0
    smooth_directional_mov_minus := nz(smooth_directional_mov_minus[1]) - nz(smooth_directional_mov_minus[1]) / adx_len + (nz(_low[1]) - _low > _high - nz(_high[1]) ? math.max(nz(_low[1]) - _low, 0) : 0)

    plus_DM = smooth_directional_mov_plus / smooth_tr * 100
    minus_DM = smooth_directional_mov_minus / smooth_tr * 100
    // DX = math.abs(plus_DM - minus_DM) / (plus_DM + minus_DM) * 100   // DX not used in this strategy
    [plus_DM, minus_DM]

// DI +/- from timeframes 1 and 2
[plus_DM_tf1, minus_DM_tf1] = get_ADX(request.security(syminfo.tickerid, tf1, high), request.security(syminfo.tickerid, tf1, close),request.security(syminfo.tickerid, tf1, low))
[plus_DM_tf2, minus_DM_tf2] = get_ADX(request.security(syminfo.tickerid, tf2, high),request.security(syminfo.tickerid, tf2, close),request.security(syminfo.tickerid, tf2, low))
// } end of block: ADX Indicator


var string ENUM_LONG      = "LONG"
var string LONG_MSG_ENTER = input.string("Long entered", title="Alert MSG for buying (Long position)", group=GROUP_ALERT)
var string LONG_MSG_EXIT  = input.string("Long closed", title="Alert MSG for closing (Long position)", group=GROUP_ALERT)
backtest_timeframe_start = input(defval=timestamp("01 Apr 2020 13:30 +0000"), title="Backtest Start Time", group=GROUP_HORIZON)
within_timeframe         = true

// Signals for entry
_uptrend_confirmed = plus_DM_tf1 > minus_DM_tf1 and plus_DM_tf2 > minus_DM_tf2
entry_signal_long = _uptrend_confirmed

plotshape(_uptrend_confirmed, style=shape.triangleup, location=location.bottom, color=color.green)
plotshape(not _uptrend_confirmed, style=shape.triangledown, location=location.bottom, color=color.red)

// Trailing stop loss ("TSL") {
tsl_multi                 = input.float(2.0, title="ATR Multiplier for trailing stoploss", group=GROUP_SL)
SL_buffer                 = ta.atr(input.int(14, title="Length of ATR for trailing stoploss", group=GROUP_SL)) * tsl_multi
TSL_source_long           = low
var stop_loss_price_long  = float(0)
var pos_opened_long       = false

stop_loss_price_long := pos_opened_long ? math.max(stop_loss_price_long, TSL_source_long - SL_buffer) : TSL_source_long - SL_buffer

// MAIN: {
if pos_opened_long and TSL_source_long <= stop_loss_price_long
    pos_opened_long := false
    alert(LONG_MSG_EXIT, alert.freq_once_per_bar)
    strategy.close(ENUM_LONG, comment=close < strategy.position_avg_price ? "stop loss" : "take profit")

// (2) Update the stoploss to latest trailing amt.
if pos_opened_long
    strategy.exit(ENUM_LONG, stop=stop_loss_price_long, comment="SL")

// (3) INITIAL ENTRY:
if within_timeframe and entry_signal_long
    pos_opened_long := true
    alert(LONG_MSG_ENTER, alert.freq_once_per_bar)
    strategy.entry(ENUM_LONG, strategy.long, comment="long")

// Plotting:
TSL_transp_long = pos_opened_long and within_timeframe ? 0 : 100
plot(stop_loss_price_long, color=color.new(color.green, TSL_transp_long))

// CLEAN UP: Setting variables back to default values once no longer in use
if ta.change(strategy.position_size) and strategy.position_size == 0
    pos_opened_long := false

if not pos_opened_long
    stop_loss_price_long := float(0)

// } end of MAIN block