RSI Trend Following Strategy

Overview
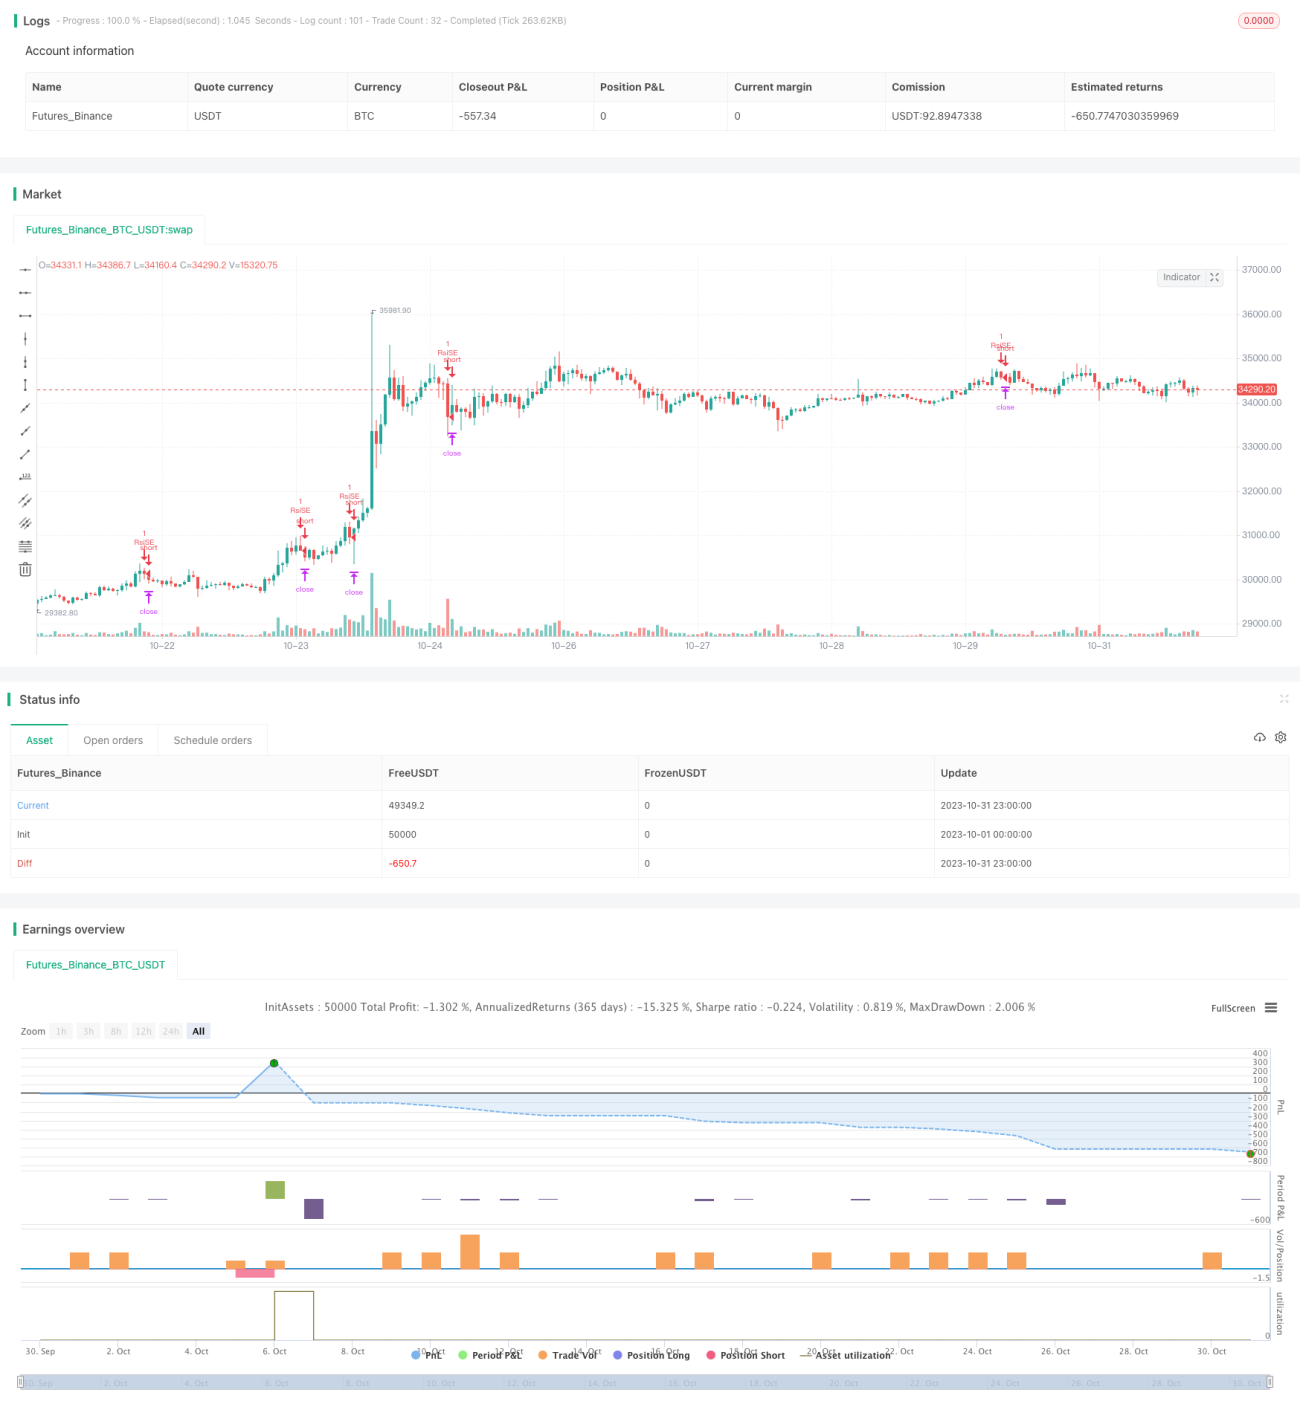
This strategy is designed based on the Relative Strength Index (RSI) indicator to identify overbought and oversold situations and follow the trend. It goes long when RSI is below the oversold line and goes short when RSI is above the overbought line, aiming to profit by following the main trend of the market.
Strategy Logic
This strategy uses the RSI indicator to identify overbought and oversold conditions in the market. RSI is calculated based on the price changes over a certain period of time. An RSI below 30 is considered oversold while an RSI above 70 is considered overbought.
Specifically, this strategy first defines the RSI parameters length=14, overbought=70, oversold=30. It then calculates the RSI value vrsi based on the close price. When vrsi crosses above the overbought line or below the oversold line, it triggers a long or short trade accordingly. After entering the trade, a stop loss of etoroStopTicks ticks is set. The positions will be closed when stop loss is triggered within the trading window.
In this way, the strategy is able to follow the major trend of the market - going long at oversold situations and going short at overbought situations.
Advantages
- Utilize RSI to identify overbought/oversold market conditions for catching the trend
- Flexible backtesting window for testing different time periods
- Reasonable stop loss setting for controlling single trade loss
Risks
- RSI divergence may generate false signals
- Static stop loss fails to adapt to market fluctuation
- Hard to identify trend reversal, may lead to reverse trades
Solutions:
- Add filter indicators to avoid wrong entries based on false RSI signal
- Dynamic stop loss to track market movement in real time
- Add trend judging tools to prevent reverse trades
Improvement
The strategy can be optimized in the following aspects:
- Optimize RSI parameters for best performance
Test different RSI periods and overbought/oversold levels to find optimum parameters and reduce false signals.
- Add trend judging tools to avoid counter trend trades
Add MA, MACD to judge trend direction and avoid wrong signals at turning points.
- Dynamic stop loss
Use ATR to set adaptive stop loss for better tracking market fluctuation.
- Improve entry rules
Add other conditions like breakout, volume increase to RSI signal to improve entry accuracy.
Conclusion
The strategy catches the trend by identifying overbought and oversold situations using RSI. Compared to traditional tracking stop strategies, it has the advantage of timing the market with indicators. However, problems like RSI divergence and inability to detect trend reversal need to be addressed. Further improvements on parameter optimization, trend judging, dynamic stop loss can enhance the stability and profitability.
- 1