KST EMA Momentum Trend Following Strategy

Overview
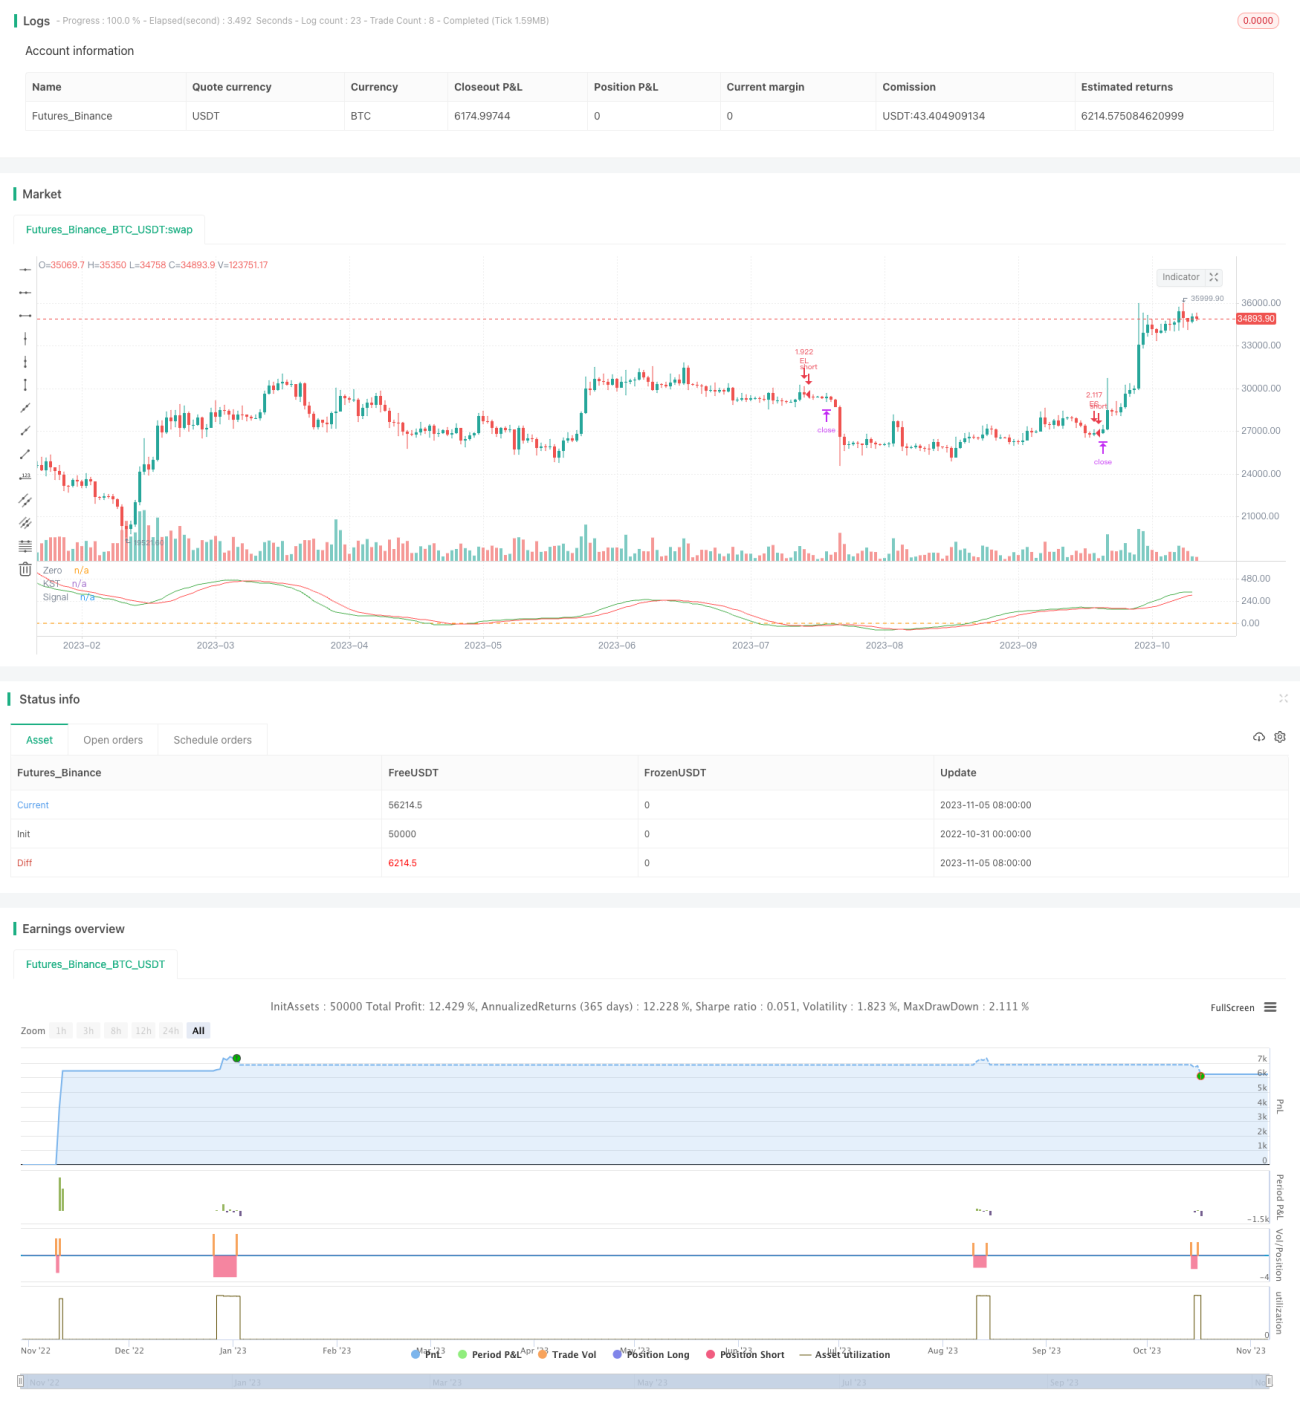
The core idea of this strategy is to combine the KST indicator and EMA lines to identify and follow trends. It generates buy signals when the KST indicator crosses above 0 and closes above the EMA line, and sell signals when it crosses below 0 and closes below the EMA line. This simple and practical strategy can automatically track trends and is suitable for medium to long term holdings.
Strategy Logic
-
Calculate the KST indicator: Compute the ROC of 10, 15, 20 and 30 periods, take a weighted sum, and smooth it with a 9-period SMA to derive the KST indicator.
-
Calculate the EMA line: Compute a 50-period EMA line.
-
Generate buy signal: When the fast KST line crosses above the slow KST line (golden cross) and is below 0, while the close is above the EMA line, a buy signal is triggered.
-
Generate sell signal: When the fast KST line crosses below the slow KST line (dead cross) and is above 0, while the close is below the EMA line, a sell signal is triggered.
-
Set trailing stop loss: The stop loss tracks 1% of account value to realize automatic stop loss.
Advantages
-
KST identifies trend changes, EMA confirms direction. Combining both accurately detects entry timing.
-
Using fast/slow crossovers and 0-line avoids unnecessary trades.
-
EMA as support/resistance further filters fake signals. Only enter on EMA breakouts.
-
Auto trailing stop loss controls risk and allows profits to run.
-
Simple parameters make implementation and optimization easy.
Risks
-
KST has lag in detecting trend changes, may miss some chances. Can shorten periods or optimize weighting.
-
EMA has lag around trend reversals. Other indicators or MA combos may work better.
-
Stop loss too wide increases losses, too tight gets stopped out by spikes. Careful testing needed to optimize.
-
Frequent signals may increase transaction costs. Can tighten entry rules to reduce trades.
Optimization Directions
-
Optimize KST periods for sensitivity to specific instruments.
-
Test other moving averages like MA, WMA to see which combines best with KST.
-
Experiment dynamic stops based on volatility metrics like ATR.
-
Add filters like volume spikes to avoid traps.
-
Consider combining with indicators like RSI, MACD for more dimensions.
-
Test parameters across instruments to optimize for each.
Conclusion
This strategy has clear, reliable logic that is easy to implement. KST identifies trend turns, EMA filters further, and stops control risk. It automatically tracks medium to long term trends. Reasonable parameters provide large optimization space. Users can tweak for different instruments. Applicable for beginners to learn and professionals to build on. With further optimization it shows promise as a robust trend following system.
/*backtest
start: 2022-10-31 00:00:00
end: 2023-11-06 00:00:00
period: 1d
basePeriod: 1h
exchanges: [{"eid":"Futures_Binance","currency":"BTC_USDT"}]
*/

//@version=4
strategy(title="Know Sure Thing and EMA Strategy by JLX", shorttitle="KST EMA JLX", format=format.price, precision=4, initial_capital = 1000, default_qty_type=strategy.percent_of_equity, default_qty_value = 100)
roclen1 = input(10, minval=1, title = "ROC Length #1")
roclen2 = input(15, minval=1, title = "ROC Length #2")- 1