VWMA and ATR Trend Following Strategy

Author: ChaoZhang, Date: 2023-11-07 16:39:47
Tags:

img

Overview

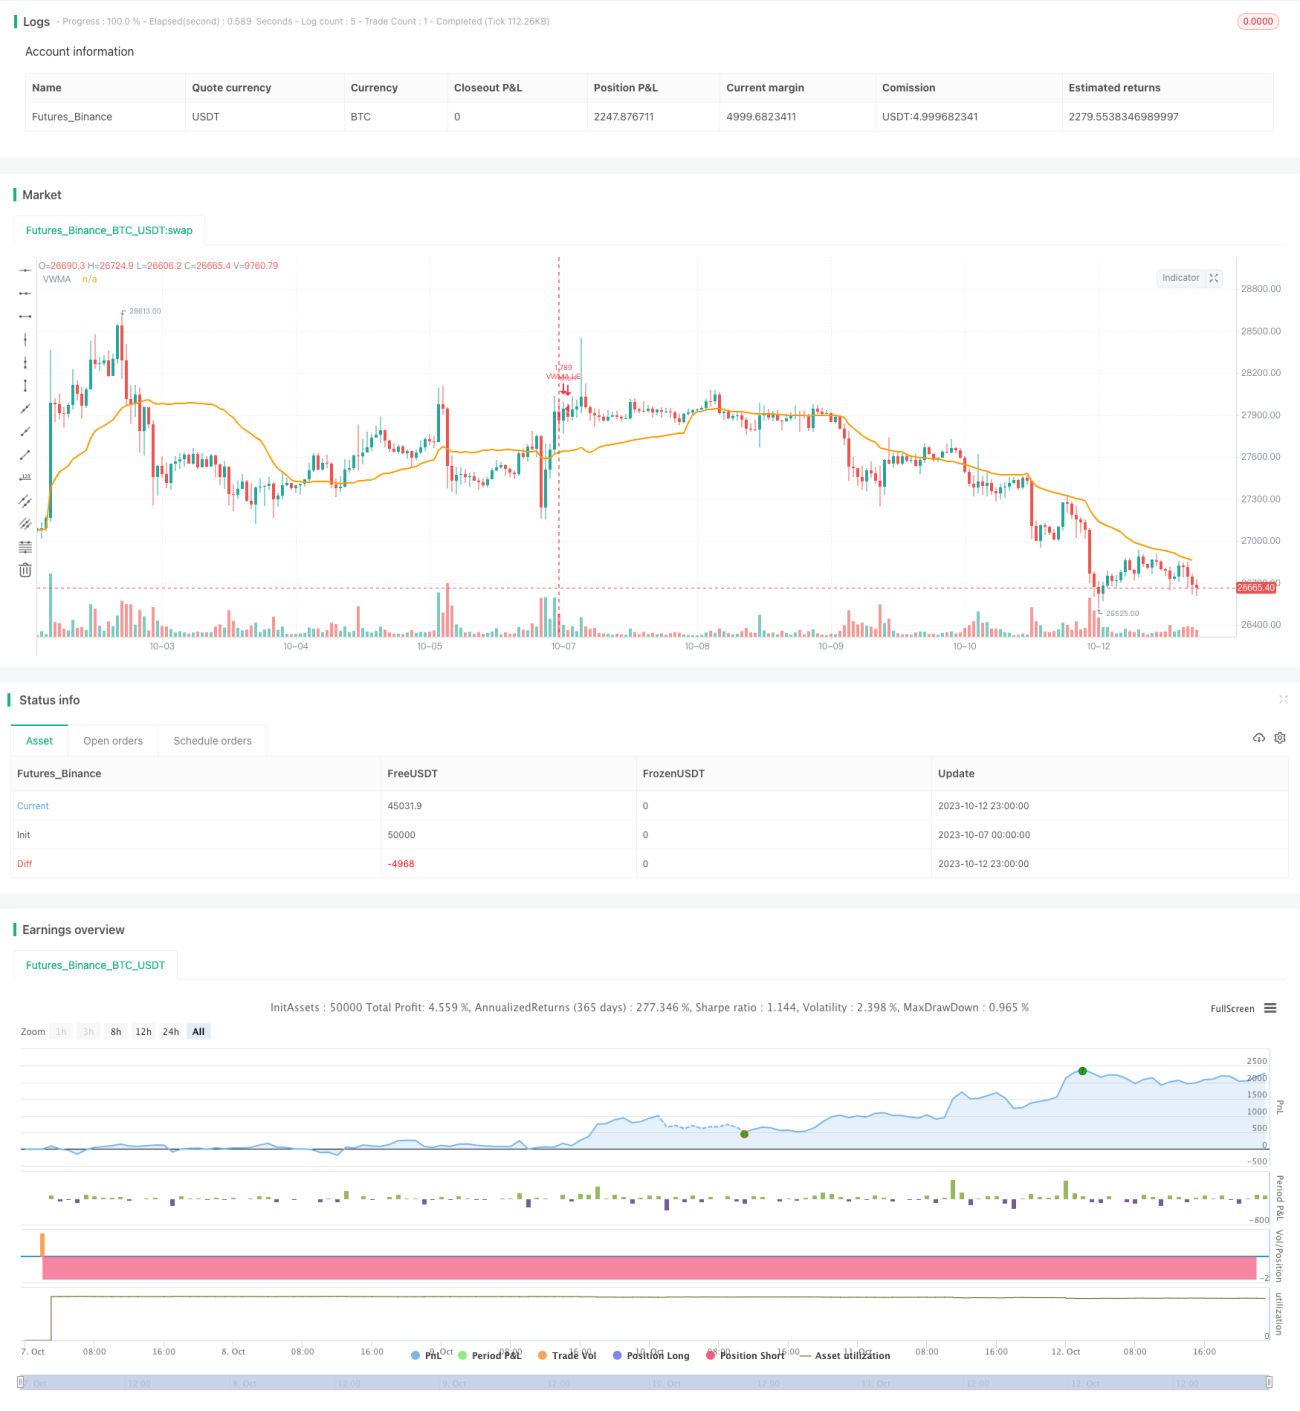
This strategy uses VWMA to determine the trend direction and sets stop loss with ATR to follow the trend. It is suitable for markets with obvious trends.

Strategy Logic

  1. Use VWMA to determine the trend direction. Go long when price is above VWMA, go short when price is below VWMA.

  2. Add RSI oscillator filter to avoid false breakout signals. Only take long signal when RSI is above 30.

  3. Use ATR to calculate the stop loss line. ATR length is set to be the same as VWMA, multiplier is 3.5. Stop loss line updates in real time.

  4. The ATR multiplier controls the tightness of the stop loss line. Larger multiplier means less frequent update, which is better for following the trend.

  5. Position size is calculated based on account equity and stop loss percentage.

  6. Exit long position when price breaks below the stop loss line.

Advantages

  1. Using VWMA to determine trend catches trend opportunities persistently.

  2. RSI filter avoids some false breakout signals.

  3. ATR trailing stop follows the trend and avoids being stopped out by reversals.

  4. Position sizing based on account equity and stop loss favors risk management.

Risks

  1. Potential loss at trend turning points. Should reduce position size to limit losses.

  2. Improper ATR parameter setting leads to too tight or loose stop loss line. Parameters should be tested.

  3. Fast trend reversal may cause stop loss update to lag, increasing losses.

  4. In low volatility environments, reduce position size and increase stop loss update frequency.

Enhancement

  1. Test different VWMA parameter combinations to find optimal signal parameters.

  2. Test other RSI settings like overbought/oversold lines.

  3. Test ATR multiplier to find optimal balance between drawdown and tracking ability.

  4. Add other filters like MACD, KD to improve signal quality.

  5. Optimize position sizing and stop loss percentage based on market volatility.

Summary

The strategy has an overall trend-following bias and catches obvious price trends well. It has advantages in trend determination, signal filtering, stop loss trailing etc. It also has risks in trend reversal. Fine tuning parameters and position sizing can lead to better performance.


/*backtest
start: 2023-10-07 00:00:00
end: 2023-10-13 00:00:00
period: 1h
basePeriod: 15m
exchanges: [{"eid":"Futures_Binance","currency":"BTC_USDT"}]
*/

// This source code is subject to the terms of the Mozilla Public License 2.0 at https://mozilla.org/MPL/2.0/
// © mohanee

//@version=4
//strategy("", overlay=true)
strategy(title="VWMA_withATRstops_strategy V2", overlay=true, pyramiding=1,     default_qty_type=strategy.percent_of_equity,  default_qty_value=20, initial_capital=10000, currency=currency.USD)  //default_qty_value=10, default_qty_type=strategy.fixed,

float xATRTrailingStop=na
int pos=na

vwmalength = input(33, title="VWMA Length", minval=1, maxval=365)
//vwmalength2 = input(9, title="VWAM Short Term Length", minval=1, maxval=365)
nATRPeriod = input(33, title="ATR length", minval=1, maxval=365)
nATRMultip = input(3.5, title="ATR Multiplier")

rsiofVwmaLength=input(14, title="RSI of VWMA Length")

riskCapital = input(title="Risk % of capital", defval=10, minval=1)
stopLoss=input(5,title="Stop Loss",minval=1)

vwmaVal=vwma(close, vwmalength)
//vwmaVal2=vwma(close, vwmalength2)
//maVal=sma(close, vwmalength)

plot(vwmaVal, color=color.orange, linewidth=2,  title="VWMA")
//plot(vwmaVal2, color=color.blue, title="VWMA Short Term")
//plot(maVal, color=color.blue, title="MA")

//rsi of vwma Longterm
rsiofVwmaVal=rsi(vwmaVal,rsiofVwmaLength)

xATR = atr(nATRPeriod)
nLoss = nATRMultip * xATR

xATRTrailingStop:= iff(close > nz(xATRTrailingStop[1], 0) and close[1] > nz(xATRTrailingStop[1], 0), max(nz(xATRTrailingStop[1]), close - nLoss), iff(close < nz(xATRTrailingStop[1], 0) and close[1] < nz(xATRTrailingStop[1], 0), min(nz(xATRTrailingStop[1]), close + nLoss), iff(close > nz(xATRTrailingStop[1], 0), close - nLoss, close + nLoss)))

pos:=	iff(close[1] < nz(xATRTrailingStop[1], 0) and close > nz(xATRTrailingStop[1], 0), 1, 	    iff(close[1] > nz(xATRTrailingStop[1], 0) and close < nz(xATRTrailingStop[1], 0), -1, nz(pos[1], 0))) 

color1 = pos == -1 ? color.red: pos == 1 ? color.green : color.blue 

//plot(xATRTrailingStop, color=color1, title="ATR Trailing Stop")

//Entry--
//Echeck how many units can be purchased based on risk manage ment and stop loss
qty1 = (strategy.equity  * riskCapital / 100 ) /  (close*stopLoss/100)  

//check if cash is sufficient  to buy qty1  , if capital not available use the available capital only
qty1:= (qty1 * close >= strategy.equity ) ? (strategy.equity / close) : qty1


//Long Entry
//strategy.entry(id="VWMA LE", long=true, qty=qty1, when= close >vwmaVal and open>vwmaVal and close>open and close > xATRTrailingStop and xATRTrailingStop>  vwmaVal)

strategy.entry(id="VWMA LE", long=true, qty=qty1, when= rsiofVwmaVal>=30 and  close>open and close>vwmaVal and pos == 1 )    ///pos == 1 means ATRStop line is green    
//vwmaVal2>vwmaVal and

plot(strategy.position_size>=1  ? xATRTrailingStop : na, color=color1, style=plot.style_linebr, title="ATR Trailing Stop")
bgcolor(strategy.position_size>=1 ? color.blue : na )

//Exit
strategy.close(id="VWMA LE",  when= strategy.position_size>=1 and crossunder(close, xATRTrailingStop)  )
//strategy.close(id="VWMA LE",  when= strategy.position_size>=1 and close<vwmaVal and open<vwmaVal and close<open )

More