Cross Timeframe Hull Moving Average Buy Sell Strategy

Overview
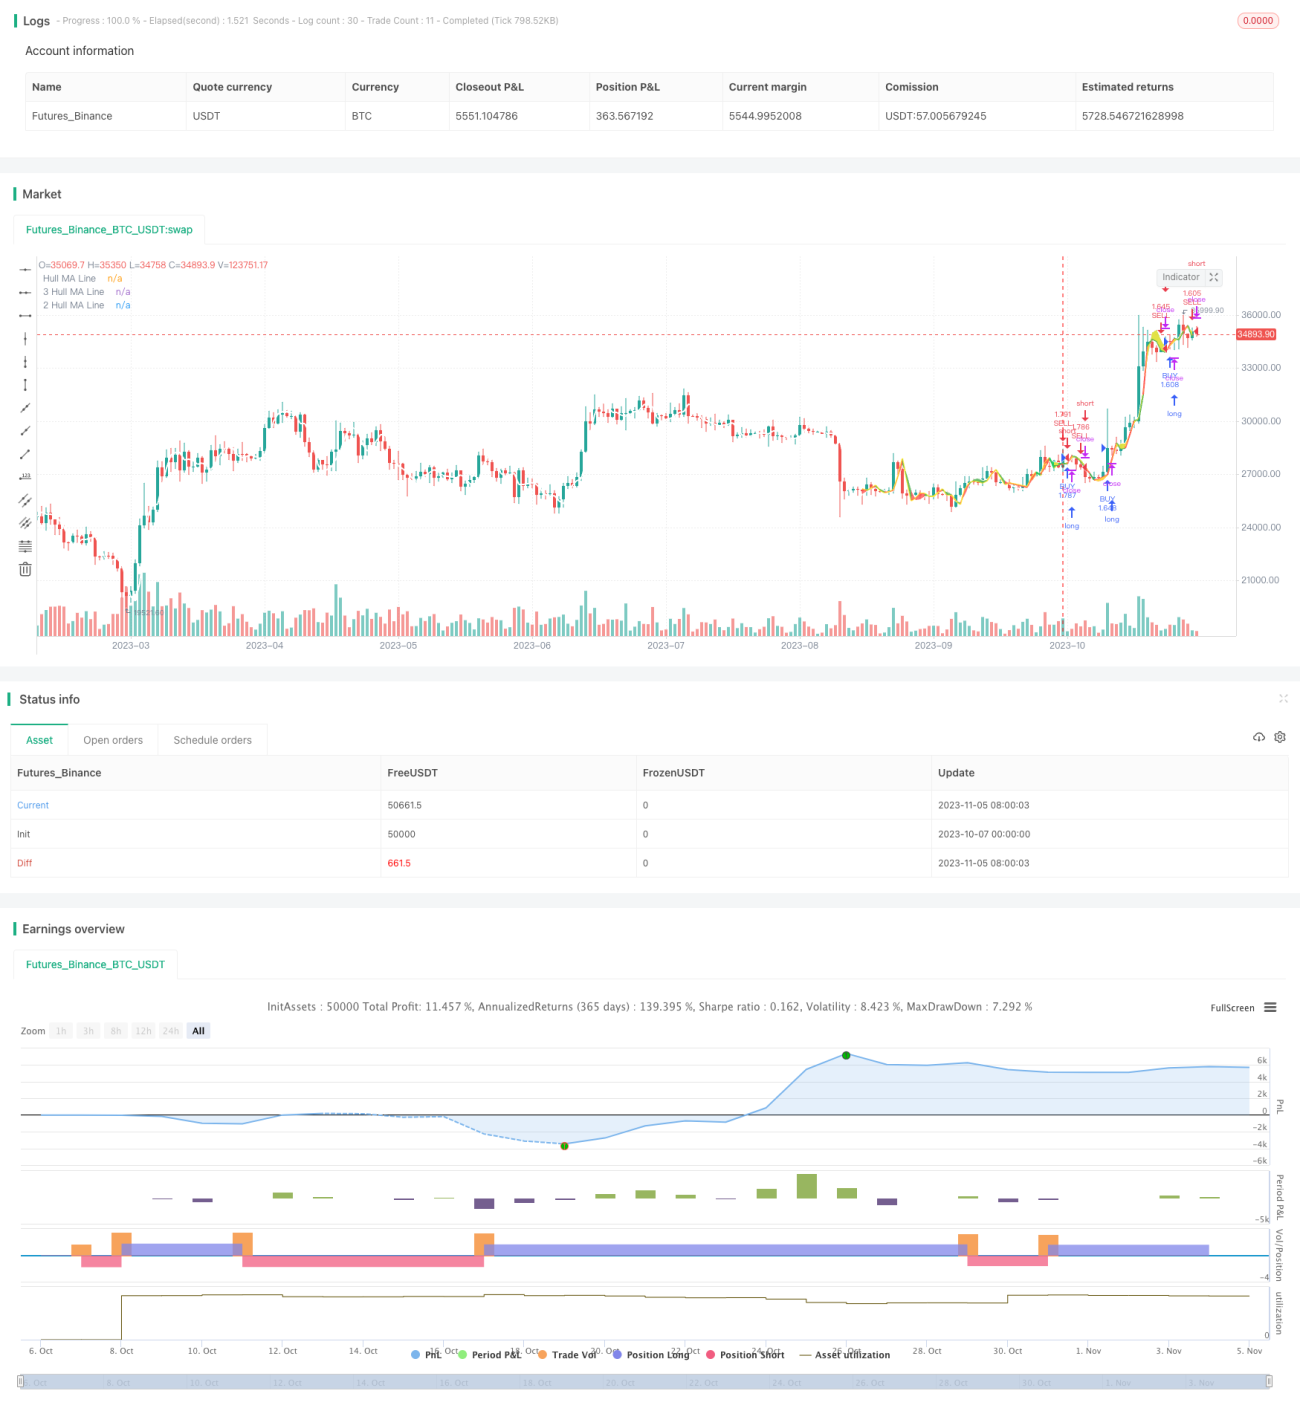
This strategy is based on the Hull Moving Average indicator, calculating Hull MA on different timeframes and comparing the Hull MA trends across timeframes to identify trend changes. It generates buy signals when the shorter period Hull MA crosses above the longer period Hull MA, and sell signals when the shorter Hull MA crosses below the longer one.
Strategy Logic
-
Input parameters: Hull MA period Period, HMA2 timeframe Resolution2, HMA3 timeframe Resolution3
-
Calculate current bar's Hull MA value HMA
-
Calculate Hull MA value HMA2 on Resolution2 timeframe
-
Calculate Hull MA value HMA3 on Resolution3 timeframe
-
Compare the magnitude relationship between HMA, HMA2, HMA3
-
Generate buy signal when HMA>HMA2>HMA3
-
Generate sell signal when HMA<HMA2<HMA3
-
Display Hull MA values and signals on different timeframes on top left of chart
-
Use colors to distinguish uptrend and downtrend
Advantage Analysis
-
Using multiple timeframes can filter false breakouts and avoid traps.
-
Customizable timeframe parameters, adaptable to different periods and volatility.
-
Real-time signal display, intuitive operation.
-
Visualized Hull MA trends help determine current trend.
Risk Analysis
-
Improper parameter settings may cause over-trading.
-
Larger timeframe Hull MA has lagging effect, may miss trend turning points.
-
May generate false signals around bull-bear transition.
-
Breakout strategies are prone to getting trapped by false breakouts.
-
Trading commissions are not considered which impacts actual profit.
Risks can be reduced by optimizing parameters, combining other indicators for filtration, and allowing wider stop loss.
Optimization Directions
-
Optimize Hull MA period adaptable to different periods and volatility.
-
Add volume indicator to avoid false breakouts.
-
Add oscillators to determine trend strength.
-
Incorporate machine learning models for buy/sell timing.
-
Combine sentiment indicators to detect market hype.
-
Adjust stop loss strategy for better risk management.
-
Customize buy/sell conditions with other indicator signals.
-
Add price channel or wave based trading strategies.
Conclusion
This strategy uses multi-timeframe Hull MA to determine trend direction by comparing moving average slopes across timeframes and generates signals at trend reversals. Multi-timeframe Hull MA is more effective in filtering false breakouts than single MA. But this strategy also has limitations in parameter tuning, trend determination etc. Integrating more indicators, optimizing parameters, improving stop loss can enhance profitability and control risk.
/*backtest
start: 2023-10-07 00:00:00
end: 2023-11-06 00:00:00
period: 1d
basePeriod: 1h
exchanges: [{"eid":"Futures_Binance","currency":"BTC_USDT"}]
*/

//@version=4
//
strategy("wtfBUYorSELLffs",overlay=true,currency="USD",initial_capital=100000,default_qty_type=strategy.percent_of_equity,default_qty_value=100,commission_type=strategy.commission.percent,commission_value=0.1)
Period=input(title="Hull MA Period",type=input.integer,defval=6,minval=1)- 1