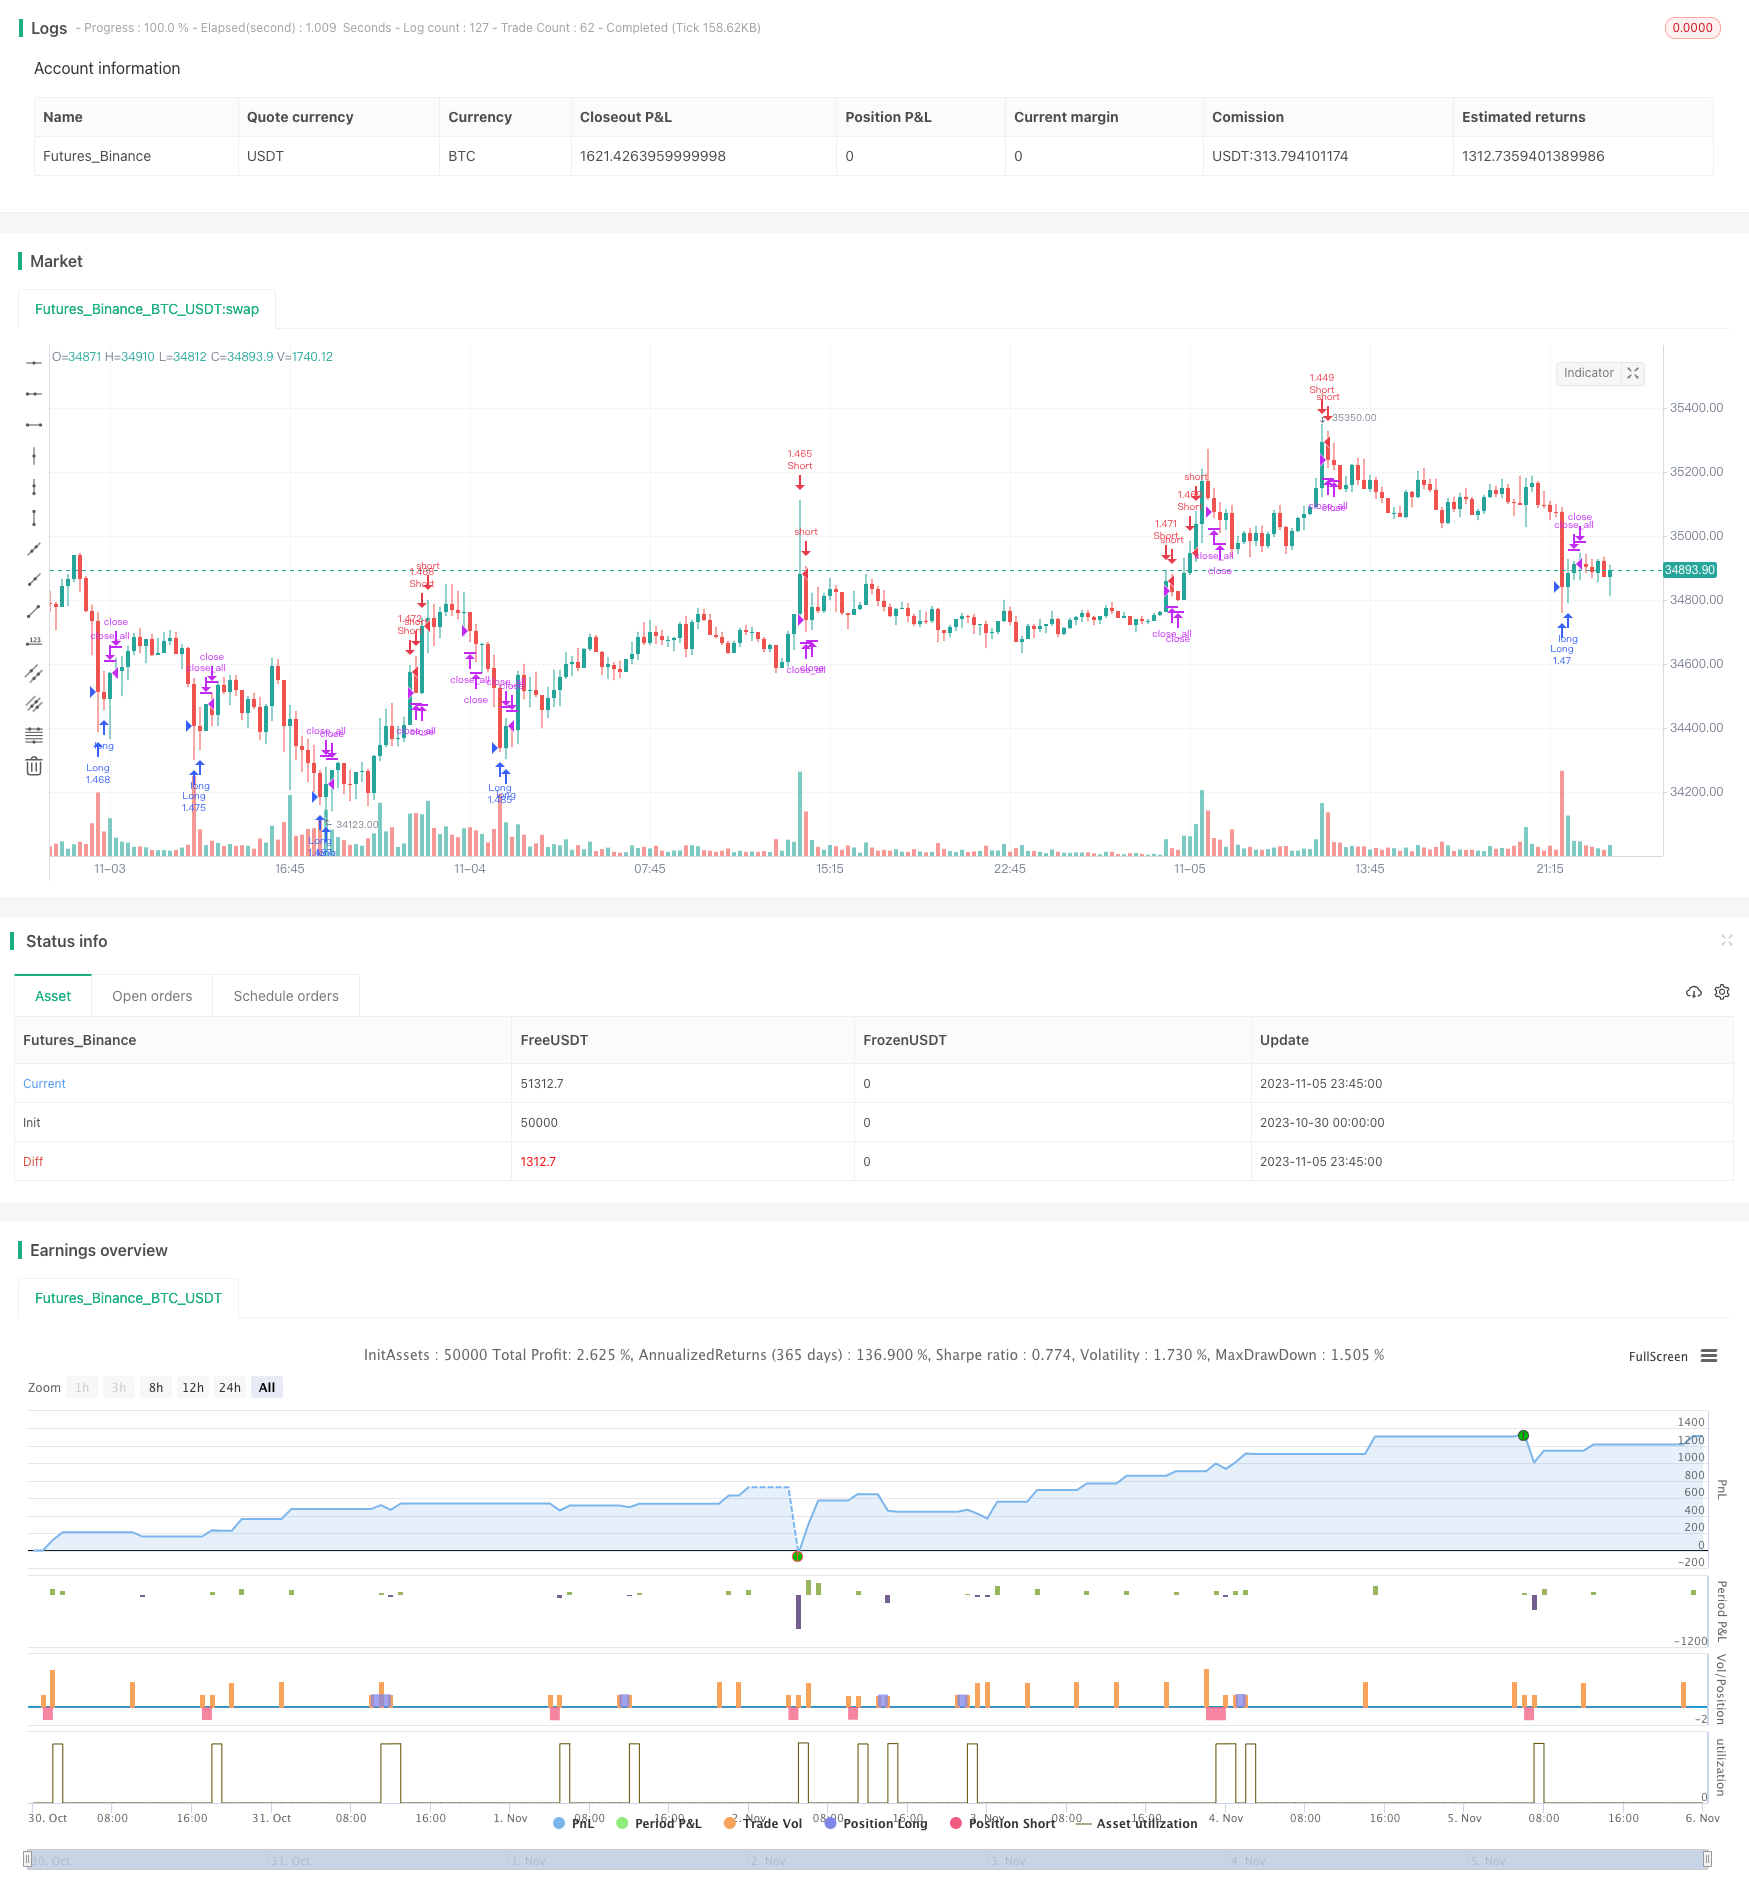
概述
该策略通过多次设置RSI指标的参数,实现价格的多次突破,从而实现更准确的入场和退出信号。
策略原理
该策略设置了两组RSI参数,分别是RSI周期为7,限制为25的RSI指标和RSI周期为14,限制为25的RSI指标。当价格突破任意一组RSI的限制时,执行做多或做空操作。
策略首先计算两组RSI指标的值,然后判断价格是否突破RSI的上限或下限。如果突破上限,则产生做多信号,如果突破下限,则产生做空信号。
如果已经持有仓位,那么会继续判断当前RSI是否在正常范围内。如果RSI正常了,同时实体突破均线的一半,则产生退出信号。
该策略还使用了马丁格尔加仓系统。每次亏损后,下次交易量会加倍。
优势分析
使用两组RSI指标,可以更准确判断突破信号,避免假突破。
同时检查实体突破,避免在震荡中错交易。
采用马丁格尔加仓,可以在亏损后快速止损。
可自定义RSI参数组合,优化入场机会。
可限定交易时间段,避免重大事件的影响。
风险分析
双RSI指标无法完全避免假突破现象。
马丁格尔会在亏损时加大仓位,容易爆仓。
未考虑交易成本的影响。
可优化的参数较多,需要大量测试找到最佳参数组合。
可以设置止损来限制亏损;优化RSI参数组合;加入成本考量;适当放宽突破判定。
策略优化方向
加入止损机制,可以限制最大亏损。
优化RSI参数组合,找到最佳的参数以减少假突破。
考虑交易成本的影响,防止过于频繁交易。
放宽实体突破判定,获得更多交易机会。
加入更多指标过滤,避免被套。
总结
该策略使用双RSI指标判断价格突破,加入实体突破判定,避免在震荡市中被套。同时采用马丁格尔加仓以快速止损。该策略可以通过参数优化以及加入更多指标过滤来获得更准确的交易信号。但需要注意风险控制,防止亏损扩大。总体来说,该策略提供了一个相对稳定的突破系统,适合追求高效率交易的投资者。
策略源码
/*backtest
start: 2023-10-30 00:00:00
end: 2023-11-06 00:00:00
period: 15m
basePeriod: 5m
exchanges: [{"eid":"Futures_Binance","currency":"BTC_USDT"}]
*/

//Noro
//2018

//@version=2
strategy(title = "Noro's Fast RSI Strategy v2.0", shorttitle = "Fast RSI str 2.0", overlay = true)

//Settings
needlong = input(true, defval = true, title = "Long")
needshort = input(true, defval = true, title = "Short")
usemar = input(false, defval = false, title = "Use Martingale")
capital = input(100, defval = 100, minval = 1, maxval = 10000, title = "Capital, %")
usersi1 = input(true, defval = true, title = "Use RSI #1")
rsiperiod1 = input(7, defval = 7, minval = 2, maxval = 50, title = "#1 RSI Period")
rsilimit1 = input(25, defval = 25, minval = 1, maxval = 100, title = "#1 RSI limit")
usersi2 = input(true, defval = true, title = "Use RSI #2")
rsiperiod2 = input(14, defval = 14, minval = 2, maxval = 50, title = "#2 RSI Period")
rsilimit2 = input(25, defval = 25, minval = 1, maxval = 100, title = "#2 RSI limit")
showarr = input(false, defval = false, title = "Show Arrows")
fromyear = input(2018, defval = 2018, minval = 1900, maxval = 2100, title = "From Year")
toyear = input(2100, defval = 2100, minval = 1900, maxval = 2100, title = "To Year")
frommonth = input(01, defval = 01, minval = 01, maxval = 12, title = "From Month")
tomonth = input(12, defval = 12, minval = 01, maxval = 12, title = "To Month")
fromday = input(01, defval = 01, minval = 01, maxval = 31, title = "From day")
today = input(31, defval = 31, minval = 01, maxval = 31, title = "To day")

//RSI #1
uprsi1 = rma(max(change(close), 0), rsiperiod1)
dnrsi1 = rma(-min(change(close), 0), rsiperiod1)
rsi1 = dnrsi1 == 0 ? 100 : uprsi1 == 0 ? 0 : 100 - (100 / (1 + uprsi1 / dnrsi1))
uplimit1 = 100 - rsilimit1
dnlimit1 = rsilimit1

//RSI #2
uprsi2 = rma(max(change(close), 0), rsiperiod2)
dnrsi2 = rma(-min(change(close), 0), rsiperiod2)
rsi2 = dnrsi2 == 0 ? 100 : uprsi2 == 0 ? 0 : 100 - (100 / (1 + uprsi2 / dnrsi2))
uplimit2 = 100 - rsilimit2
dnlimit2 = rsilimit2

//Body
body = abs(close - open)
abody = sma(body, 10)

//Signals
bar = close > open ? 1 : close < open ? -1 : 0
up1 = bar == -1 and (strategy.position_size == 0 or close < strategy.position_avg_price) and rsi1 < dnlimit1 and body > abody / 5 and usersi1
dn1 = bar == 1 and (strategy.position_size == 0 or close > strategy.position_avg_price) and rsi1 > uplimit1 and body > abody / 5 and usersi1
up2 = bar == -1 and (strategy.position_size == 0 or close < strategy.position_avg_price) and rsi2 < dnlimit2 and body > abody / 5 and usersi2
dn2 = bar == 1 and (strategy.position_size == 0 or close > strategy.position_avg_price) and rsi2 > uplimit2 and body > abody / 5 and usersi2
norma = rsi1 > dnlimit1 and rsi1 < uplimit1 and rsi2 > dnlimit2 and rsi2 < uplimit2
exit = (((strategy.position_size > 0 and bar == 1 and norma) or (strategy.position_size < 0 and bar == -1 and norma)) and body > abody / 2)

//Arrows
col = exit ? black : up1 or dn1 ? blue : up2 or dn2 ? red : na
needup = up1 or up2
needdn = dn1 or dn2
needexitup = exit and strategy.position_size < 0
needexitdn = exit and strategy.position_size > 0
plotarrow(showarr and needup ? 1 : na, colorup = blue, colordown = blue, transp = 0)
plotarrow(showarr and needdn ? -1 : na, colorup = blue, colordown = blue, transp = 0)
plotarrow(showarr and needexitup ? 1 : na, colorup = black, colordown = black, transp = 0)
plotarrow(showarr and needexitdn ? -1 : na, colorup = black, colordown = black, transp = 0)

//Trading
profit = exit ? ((strategy.position_size > 0 and close > strategy.position_avg_price) or (strategy.position_size < 0 and close < strategy.position_avg_price)) ? 1 : -1 : profit[1]
mult = usemar ? exit ? profit == -1 ? mult[1] * 2 : 1 : mult[1] : 1
lot = strategy.position_size == 0 ? strategy.equity / close * capital / 100 * mult : lot[1]

if up1 or up2
    if strategy.position_size < 0
        strategy.close_all()

    strategy.entry("Long", strategy.long, needlong == false ? 0 : lot)

if dn1 or dn2
    if strategy.position_size > 0
        strategy.close_all()

    strategy.entry("Short", strategy.short, needshort == false ? 0 : lot)

if  exit
    strategy.close_all()