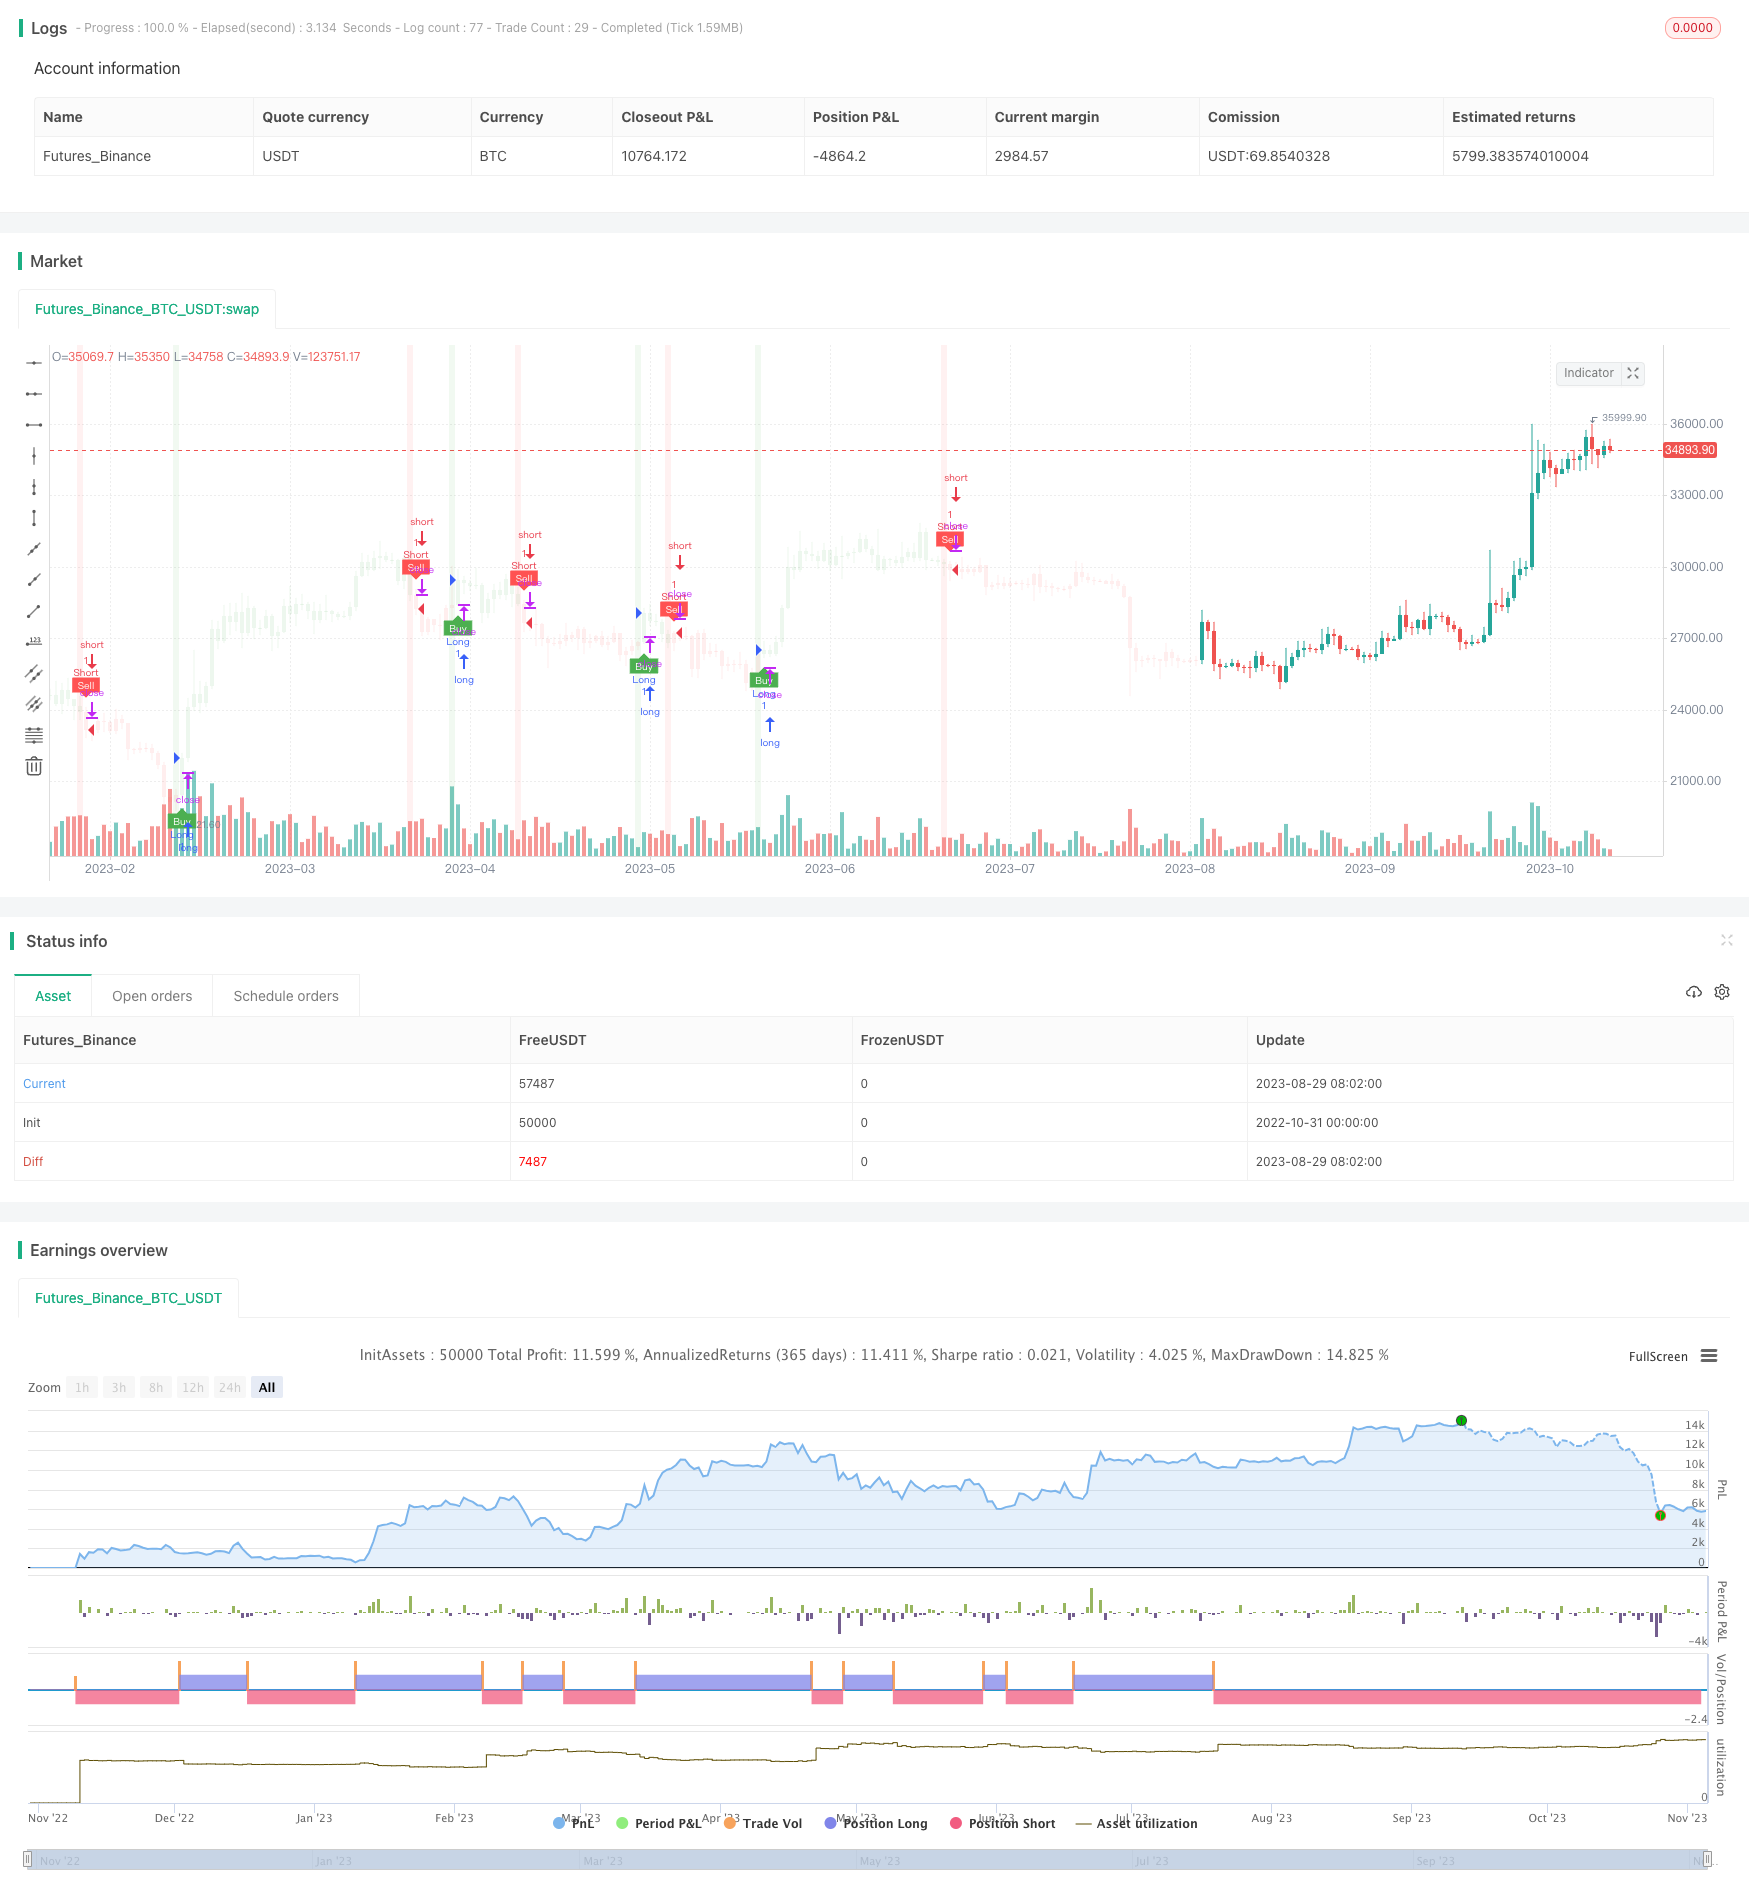
概述
该策略利用T3移动平均线、ATR指标和海克力的组合,识别买入和卖出信号,并根据ATR计算止损止盈位置,实现趋势跟踪交易。策略优势是响应迅速,同时控制了交易风险。
原理分析
指标计算
T3移动平均线:计算一个平滑的参数为T3(默认100)的T3移动平均线,用于判断趋势方向。
ATR:计算ATR(平均真实波动幅度),用于确定止损止盈位置的大小。
ATR移动止损:基于ATR计算一个移动止损线,可以根据价格变化和波动率进行调整,实现趋势跟踪。
交易逻辑
买入信号:当收盘价上穿ATR移动止损线且低于T3平均线时产生买入信号。
卖出信号:当收盘价下穿ATR移动止损线且高于T3平均线时产生卖出信号。
止损止盈:入场后,根据ATR值和用户设定的风险回报比率计算止损和止盈价格。
策略入场和出场
买入后,止损价格为入场价减去ATR值,止盈价格为入场价加上ATR值乘以风险回报比率。
卖出后,止损价格为入场价加上ATR值,止盈价格为入场价减去ATR值乘以风险回报比率。
当价格触发止损或止盈价位时,平仓离场。
优势分析
响应迅速
T3平均线参数默认为100,相比一般的移动平均线更加灵敏,可以更快响应价格变化。
风险控制
使用ATR计算的移动止损可以根据市场波动 trail 价格,避免止损被突破的风险。止盈止损位置以ATR为基础,可以控制每笔交易的风险回报比。
趋势跟踪
ATR移动止损线能够跟踪趋势,即使在价格短期回调时也不会被触发离场,从而减少了错误信号。
参数优化空间
T3平均线周期和ATR周期都可以进行优化,从而针对不同市场调整参数,提高策略稳定性。
风险分析
突破风险
如果出现剧烈行情,价格可能直接突破止损线造成损失。可以适当扩大ATR周期和止损距离来缓解。
趋势反转风险
在趋势反转时,价格穿越移动止损线可能造成损失。可以结合其他指标判断趋势,避免在反转点附近交易。
参数优化风险
参数优化需要丰富的历史数据支持,存在过优化风险。应该采用多市场多时间周期组合优化参数,不能依赖单一数据集。
优化方向
测试不同T3平均线周期参数,找到平衡灵敏度和稳定性的最佳参数组合
测试ATR周期参数,在控制风险和获取趋势之间找到最佳平衡
结合RSI、MACD等指标,避免趋势反转点错误交易
采用机器学习方法训练最优参数,降低人工优化局限性
增加仓位管理策略,更好地控制风险
总结
本策略整合T3均线和ATR指标的优势,既能快速响应价格变化,又能控制风险。通过 Parameter 优化和结合其他指标可以进一步增强策略稳定性和交易效率。但交易者仍需注意反转和突破的风险,避免过度依赖回测结果。
/*backtest
start: 2022-10-31 00:00:00
end: 2023-11-06 00:00:00
period: 1d
basePeriod: 1h
exchanges: [{"eid":"Futures_Binance","currency":"BTC_USDT"}]
*/

//@version=5
strategy(title='UT Bot Alerts (QuantNomad) Strategy w/ NinjaView', overlay=true)
T3 = input(100)//600
// Input for Long Settings
// Input for Long Settings


xPrice3 = close
xe1 = ta.ema(xPrice3, T3)
xe2 = ta.ema(xe1, T3)
xe3 = ta.ema(xe2, T3)
xe4 = ta.ema(xe3, T3)
xe5 = ta.ema(xe4, T3)
xe6 = ta.ema(xe5, T3)

b3 = 0.7
c1 = -b3*b3*b3
c2 = 3*b3*b3+3*b3*b3*b3
c3 = -6*b3*b3-3*b3-3*b3*b3*b3
c4 = 1+3*b3+b3*b3*b3+3*b3*b3
nT3Average = c1 * xe6 + c2 * xe5 + c3 * xe4 + c4 * xe3

//plot(nT3Average, color=color.white, title="T3")

// Buy Signal - Price is below T3 Average
buySignal3 = xPrice3 < nT3Average
sellSignal3 = xPrice3 > nT3Average
// Inputs
a = input(1, title='Key Value. "This changes the sensitivity"')
c = input(50, title='ATR Period')
h = input(true, title='Signals from Heikin Ashi Candles')
riskRewardRatio = input(1, title='Risk Reward Ratio')

xATR = ta.atr(c)
nLoss = a * xATR

src = h ? request.security(ticker.heikinashi(syminfo.tickerid), timeframe.period, close, lookahead=barmerge.lookahead_off) : close

xATRTrailingStop = 0.0
iff_1 = src > nz(xATRTrailingStop[1], 0) ? src - nLoss : src + nLoss
iff_2 = src < nz(xATRTrailingStop[1], 0) and src[1] < nz(xATRTrailingStop[1], 0) ? math.min(nz(xATRTrailingStop[1]), src + nLoss) : iff_1
xATRTrailingStop := src > nz(xATRTrailingStop[1], 0) and src[1] > nz(xATRTrailingStop[1], 0) ? math.max(nz(xATRTrailingStop[1]), src - nLoss) : iff_2

pos = 0
iff_3 = src[1] > nz(xATRTrailingStop[1], 0) and src < nz(xATRTrailingStop[1], 0) ? -1 : nz(pos[1], 0)
pos := src[1] < nz(xATRTrailingStop[1], 0) and src > nz(xATRTrailingStop[1], 0) ? 1 : iff_3

xcolor = pos == -1 ? color.red : pos == 1 ? color.green : color.blue

ema = ta.ema(src, 1)
above = ta.crossover(ema, xATRTrailingStop)
below = ta.crossunder(ema, xATRTrailingStop)

buy = src > xATRTrailingStop and above
sell = src < xATRTrailingStop and below

barbuy = src > xATRTrailingStop
barsell = src < xATRTrailingStop

plotshape(buy, title='Buy', text='Buy', style=shape.labelup, location=location.belowbar, color=color.new(color.green, 0), textcolor=color.new(color.white, 0), size=size.tiny)
plotshape(sell, title='Sell', text='Sell', style=shape.labeldown, location=location.abovebar, color=color.new(color.red, 0), textcolor=color.new(color.white, 0), size=size.tiny)

barcolor(barbuy ? color.new(color.green, 90) : na)
barcolor(barsell ? color.new(color.red, 90) : na)

var float entryPrice = na
var float takeProfitLong = na
var float stopLossLong = na
var float takeProfitShort = na
var float stopLossShort = na

if buy and buySignal3
    entryPrice := src
    takeProfitLong := entryPrice + nLoss * riskRewardRatio
    stopLossLong := entryPrice - nLoss
    takeProfitShort := na
    stopLossShort := na

if sell and sellSignal3
    entryPrice := src
    takeProfitShort := entryPrice - nLoss * riskRewardRatio
    stopLossShort := entryPrice + nLoss
    takeProfitLong := na
    stopLossLong := na

// Strategy order conditions
acct = "Sim101"
ticker = "ES 12-23"
qty = 1

OCOMarketLong = '{ "alert": "OCO Market Long", "account": "' + str.tostring(acct) + '", "ticker": "' + str.tostring(ticker) + '", "qty": "' + str.tostring(qty) + '", "take_profit_price": "' + str.tostring(takeProfitLong) + '", "stop_price": "' + str.tostring(stopLossLong) + '", "tif": "DAY" }'
OCOMarketShort = '{ "alert": "OCO Market Short", "account": "' + str.tostring(acct) + '", "ticker": "' + str.tostring(ticker) + '", "qty": "' + str.tostring(qty) + '", "take_profit_price": "' + str.tostring(takeProfitShort) + '", "stop_price": "' + str.tostring(stopLossShort) + '", "tif": "DAY" }'
CloseAll = '{ "alert": "Close All", "account": "' + str.tostring(acct) + '", "ticker": "' + str.tostring(ticker) + '" }'

strategy.entry("Long", strategy.long, when=buy ,alert_message=OCOMarketLong)
strategy.entry("Short", strategy.short, when=sell , alert_message=OCOMarketShort)

// Setting the take profit and stop loss for long trades
strategy.exit("Take Profit/Stop Loss", "Long", stop=stopLossLong, limit=takeProfitLong,alert_message=CloseAll)

// Setting the take profit and stop loss for short trades
strategy.exit("Take Profit/Stop Loss", "Short", stop=stopLossShort, limit=takeProfitShort,alert_message=CloseAll)

// Plot trade setup boxes
bgcolor(buy ? color.new(color.green, 90) : na, transp=0, offset=-1)
bgcolor(sell ? color.new(color.red, 90) : na, transp=0, offset=-1)

longCondition = buy and not na(entryPrice)
shortCondition = sell and not na(entryPrice)

var line longTakeProfitLine = na
var line longStopLossLine = na
var line shortTakeProfitLine = na
var line shortStopLossLine = na

if longCondition
    longTakeProfitLine := line.new(bar_index, takeProfitLong, bar_index + 1, takeProfitLong, color=color.green, width=2)
    longStopLossLine := line.new(bar_index, stopLossLong, bar_index + 1, stopLossLong, color=color.red, width=2)
    label.new(bar_index + 1, takeProfitLong, str.tostring(takeProfitLong, "#.#####"), color=color.green, style=label.style_none, textcolor=color.green, size=size.tiny)
    label.new(bar_index + 1, stopLossLong, str.tostring(stopLossLong, "#.#####"), color=color.red, style=label.style_none, textcolor=color.red, size=size.tiny)

if shortCondition
    shortTakeProfitLine := line.new(bar_index, takeProfitShort, bar_index + 1, takeProfitShort, color=color.green, width=2)
    shortStopLossLine := line.new(bar_index, stopLossShort, bar_index + 1, stopLossShort, color=color.red, width=2)
    label.new(bar_index + 1, takeProfitShort, str.tostring(takeProfitShort, "#.#####"), color=color.green, style=label.style_none, textcolor=color.green, size=size.tiny)
    label.new(bar_index + 1, stopLossShort, str.tostring(stopLossShort, "#.#####"), color=color.red, style=label.style_none, textcolor=color.red, size=size.tiny)

alertcondition(buy, 'UT Long', 'UT Long')
alertcondition(sell, 'UT Short', 'UT Short')