RSI True Level Breakout Strategy

Overview
The RSI True Level breakout strategy combines the RSI indicator with adaptive True Level channels to implement breakout trading. It calculates True Level upper and lower bands and uses RSI overbought/oversold signals to generate breakout trades. In trending markets, it can early capture the trend direction. In range-bound markets, it can effectively filter out noise and catch significant directional opportunities.
Strategy Logic
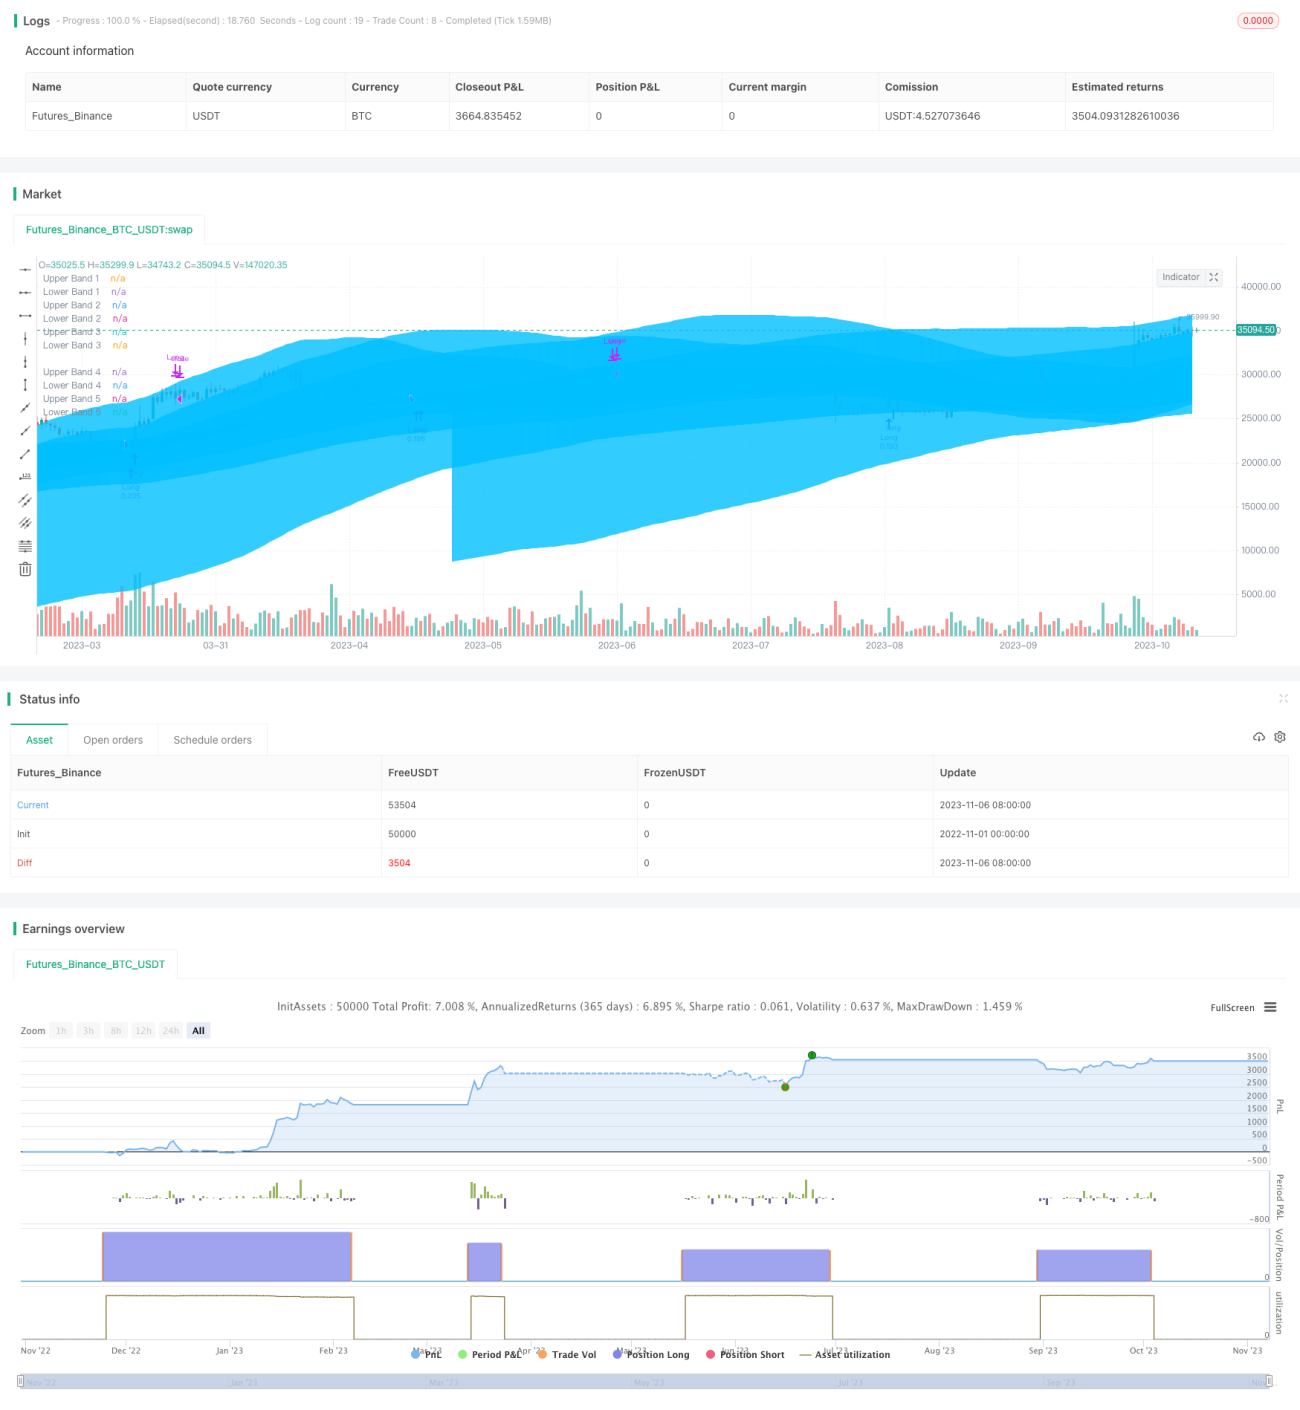
The strategy first requires manually setting 14 True Level bands with different parameters. True Levels are calculated based on closing prices, standard deviation and linear regression over a certain period. The upper band is linear regression + n standard deviations. The lower band is linear regression - n standard deviations. The n can be adjusted through the input panel. This plots 14 True Level bands with different parameters.
Next, the strategy calculates the highest of the 14 bands as the True Level upper band, and the lowest as the lower band in each period. Combined with the RSI indicator values, it determines if RSI enters overbought or oversold zones. When RSI is overbought or price breaks below the upper band, it goes short. When RSI is oversold or price breaks above the lower band, it goes long.
Finally, entry and exit bands are set. The entry band is the lower True Level and the exit band is the upper True Level. After opening positions, prices touching the exit band again will close the trades.
In summary, the strategy utilizes both the trending strength of RSI and the adaptive ability of True Level channels to effectively determine trend direction, catch big opportunities in range-bound markets, and control risk with the exit bands.
Advantages
-
Uses adaptive True Level zones. The upper and lower bands change dynamically to adapt to market fluctuations.
-
Customizable True Level parameters. Users can optimize parameters for different market conditions.
-
Combines RSI overbought/oversold to avoid whipsaws in sideways markets.
-
Reasonable entry and exit line design controls risk.
Risks
-
RSI parameters need careful optimization. Wrong values may generate bad signals.
-
True Level parameters need testing and optimization. Unsuitable settings could undermine performance.
-
High whipsaw risk in choppy markets when prices hit exit bands frequently.
-
True Level bands need sufficient period to form. The strategy may fail with inadequate data.
Risks can be mitigated by optimizing RSI parameters, adjusting True Level settings, adding filters and using wise exits. Parameters should be tuned for different market environments.
Optimization Directions
-
Optimize RSI parameters to find best settings. Test different RSI periods.
-
Optimize True Level parameters for current markets.
-
Add other filters like MACD, KD to avoid bad trades in choppy markets.
-
Test different trading times or products to find optimal environment.
-
Optimize exits, like trailing stops or ATR-based stops.
-
Combine parameters and test for maximum stability.
-
Utilize machine learning and big data to auto optimize.
Conclusion
The RSI True Level breakout strategy combines the strengths of a trend indicator and adaptive channels. It can effectively determine trend direction and catch big opportunities in range-bound markets while controlling risk with stop loss. The high parameter customization allows tuning it for different market conditions. Overall, by integrating multiple indicators, it has advantages in trend determination and risk control. With further optimization, it is a recommended quantitative trading strategy.
- 1