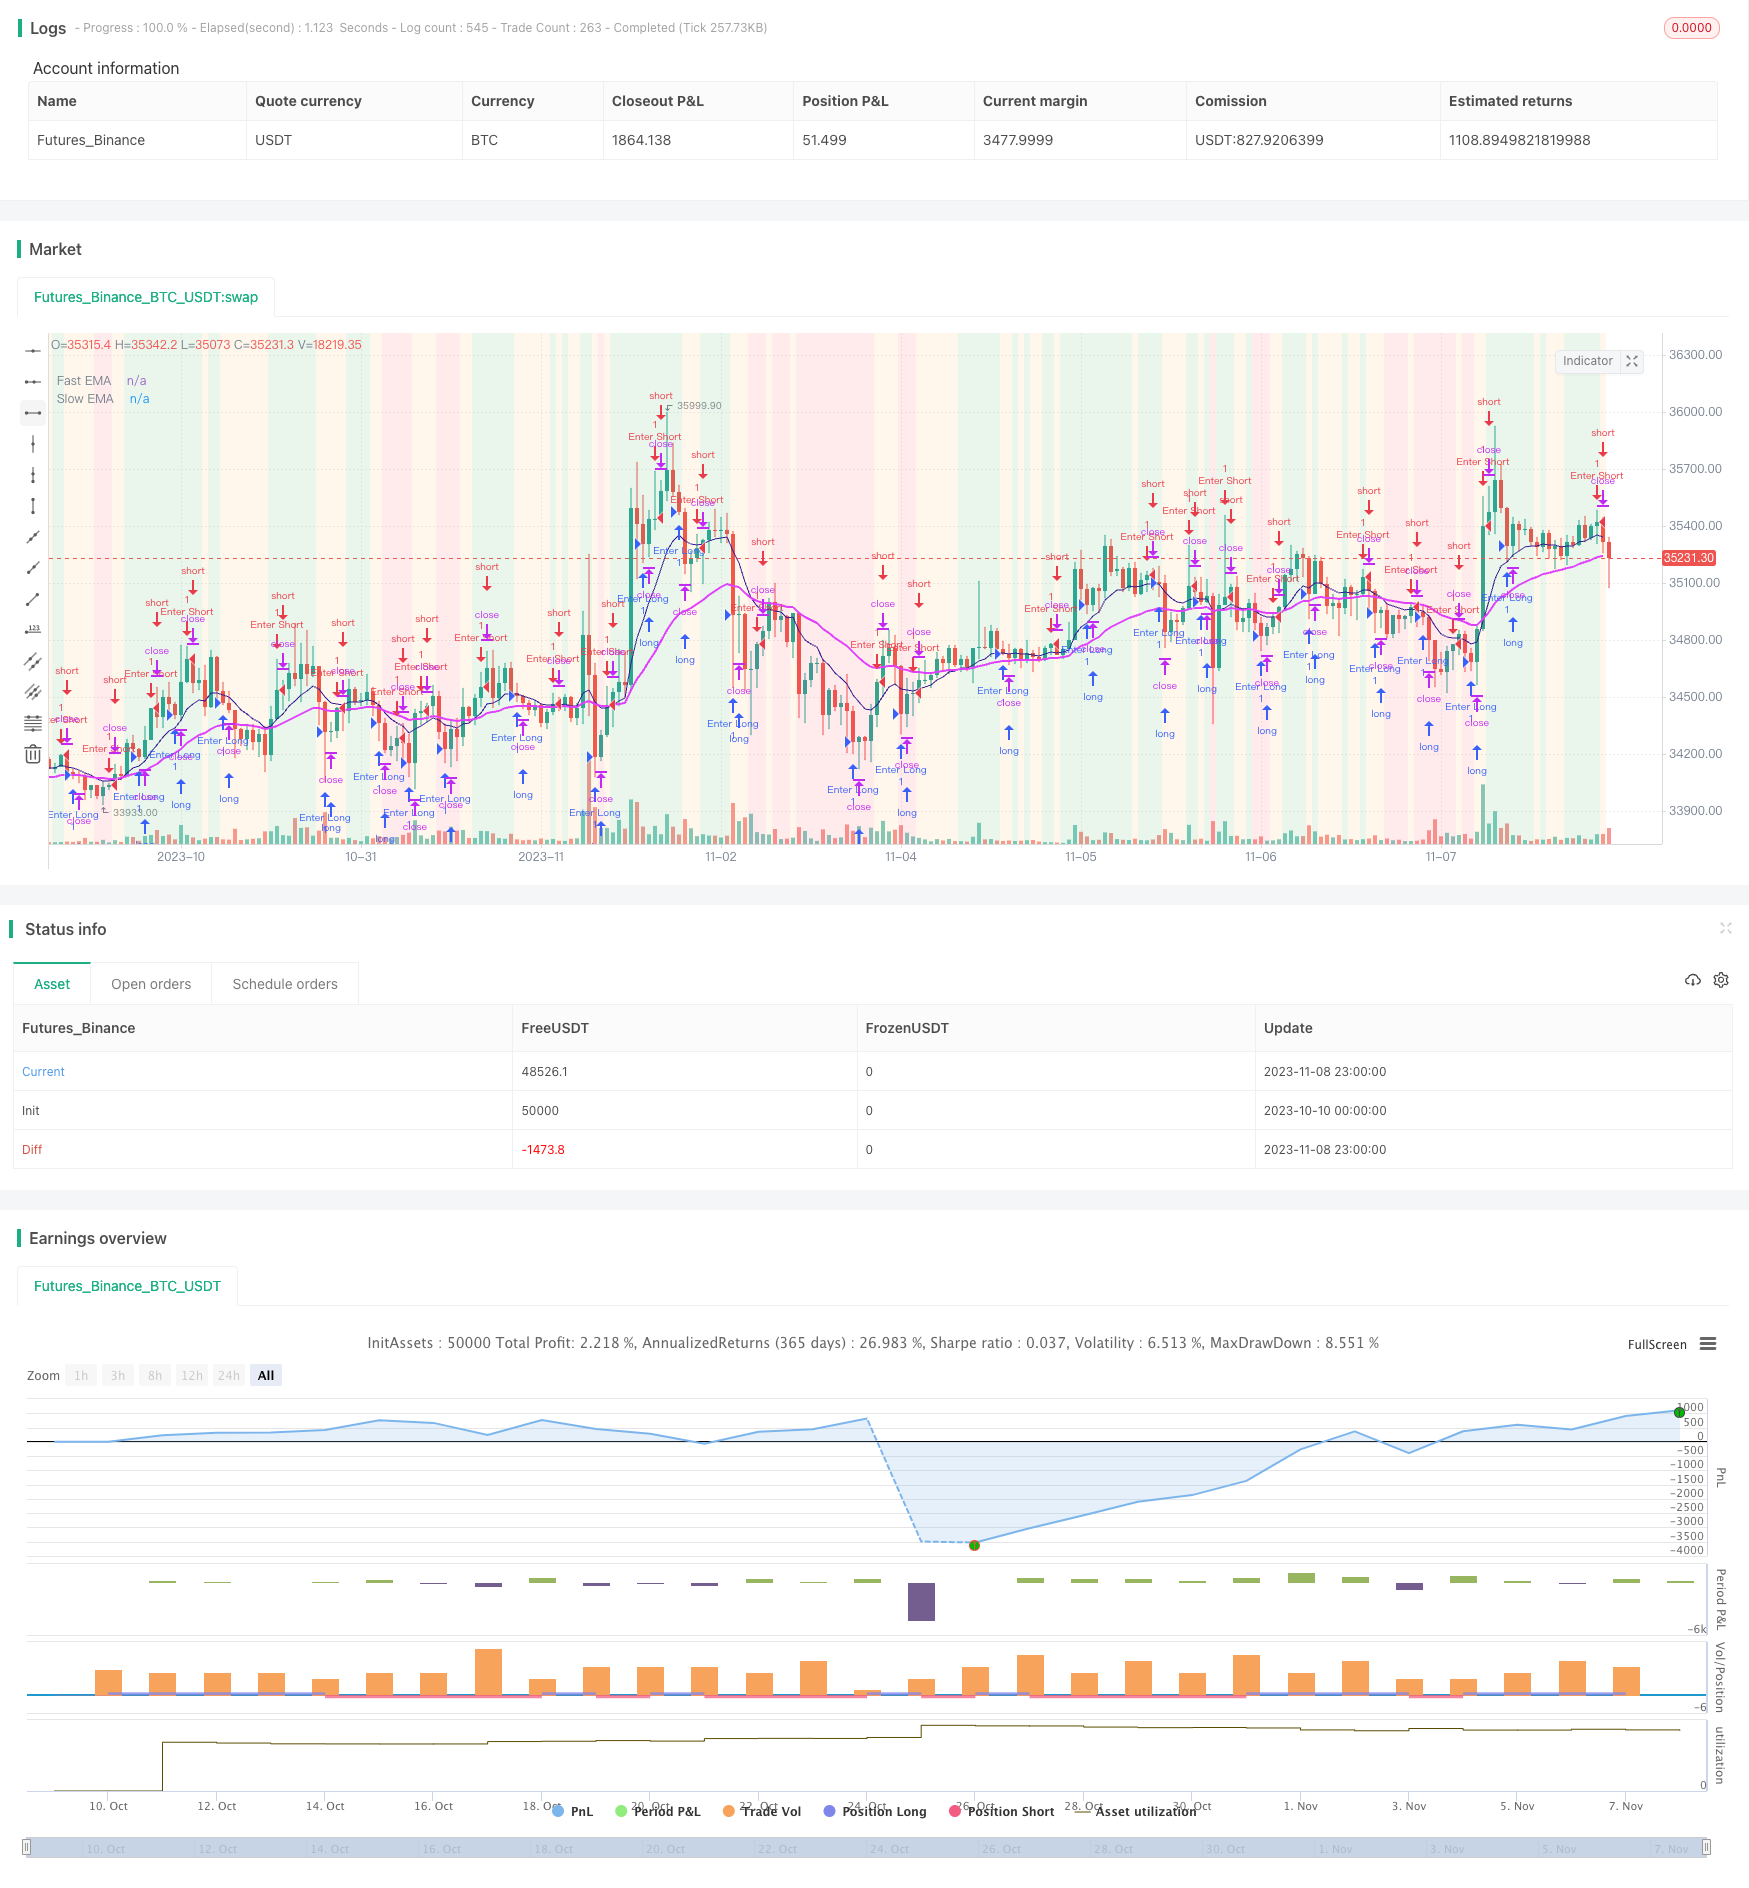
概述
本策略基于快速和慢速移动均线的金叉死叉原理设计。当快速均线从下方上穿慢速均线时,做多;当快速均线从上方下穿慢速均线时,做空。该策略适用于中长线交易,能捕捉市场趋势的反转。
策略原理
该策略使用exponential moving average(EMA)计算快慢均线。快速均线长度为10周期,慢速均线长度为30周期。策略首先计算出快速EMA和慢速EMA,然后绘制均线并显示不同颜色的背景来指示均线趋势方向。
当今日收盘价高于快速均线,且快速均线高于慢速均线时,显示绿色背景,表示处于上涨趋势。当今日收盘价低于快速均线,且快速均线低于慢速均线时,显示红色背景,表示处于下跌趋势。
在上涨趋势下,如果出现红色K线(收盘价低于开盘价),并且昨日也是红色K线,则做多入场。设置止损位300点,止盈为平仓做空。
在下跌趋势下,如果出现绿色K线(收盘价高于开盘价),并且昨日也是绿色K线,则做空入场。设置止损位300点,止盈为平仓做多。
每个交易方向开仓后,如果持仓超过1008000000毫秒(约2周),则强制平仓,防止死胶。
优势分析
- 使用双EMA系统,能有效过滤市场噪音,识别趋势反转点
- 快慢均线配合K线实体颜色判断,入场信号较为可靠
- 设定止损止盈策略,降低个别交易的损失
- 强制平仓机制,避免死胶带来的巨额损失
风险分析
- EMA系统对ese边markets不敏感,可能漏失部分交易机会
- 快速均线和慢速均线参数设置不当,可能导致虚假信号
- 止损点过浅,增加爆仓风险。止损点过深,可能造成不必要损失
- 强制平仓时间设置不当,可能导致过早平仓或持仓时间过长
优化方向
- 可以测试不同参数下EMA系统的收益率,优化快慢均线的长度
- 可以考虑加入MACD等其他指标进行确认,提高信号准确率
- 可以结合当日交易量变化来决定止损点位
- 可以根据市场波动范围动态调整强制平仓时间
总结
本策略整体来说较为均衡,使用双EMA识别趋势,并结合K线实体配合附加规则进行交易,可以有效过滤假信号。但EMA系统和参数设置仍需优化,止损止盈机制也需要根据市场调整,整体而言是一个可靠的趋势交易策略。
策略源码
/*backtest
start: 2023-10-10 00:00:00
end: 2023-11-09 00:00:00
period: 1h
basePeriod: 15m
exchanges: [{"eid":"Futures_Binance","currency":"BTC_USDT"}]
*/

// This source code is subject to the terms of the Mozilla Public License 2.0 at https://mozilla.org/MPL/2.0/
// © yeainshukla

//@version=5


strategy('BuyRedSellGreen4H', overlay = true)
greenCandle = close > open
redCandle = open > close

start  = timestamp(2023,9,18,0,00)
end = timestamp(2023,12,31,0,00)


fastLength = input.int(10, title="Fast Average Length")
slowLength = input.int(30, title="Slow Average Length")

averageData = input.source(close, title="Average Data Source")

// Calculate exponential moving averages
fastAverage = ta.ema(averageData, fastLength)
slowAverage = ta.ema(averageData, slowLength)

// Plot averages
plot(fastAverage, color=color.navy, title="Fast EMA")
plot(slowAverage, color=color.fuchsia, linewidth=2, title="Slow EMA")

// Show the moving average trend with a coloured background
backgroundColor = if close > fastAverage and fastAverage > slowAverage
    color.new(color.green, 85)
else if close < fastAverage and fastAverage < slowAverage
    color.new(color.red, 85)
else
    color.new(color.orange, 90)

bgcolor(backgroundColor, title="EMA Background")


if time >= start and time < end
    if(close < open)
        if(close[1] < open[1])
            strategy.entry("Enter Long", strategy.long)
            strategy.exit("Exit Long", from_entry="Enter Long")
            strategy.close("Enter Short")

    else
        if(close[1] > open[1])
            strategy.entry("Enter Short", strategy.short)
            strategy.exit("Exit Short", from_entry="Enter Short")
            strategy.close("Enter Long")
    if strategy.position_size < 0 or strategy.position_size > 0// short and long is opened.
        if((time - strategy.opentrades.entry_time(strategy.opentrades - 1)) > 1008000000)
            strategy.close("Enter Short")
            strategy.close("Enter Long")