Dual Moving Average RSI Indicator Combination Reversal Strategy

Overview
This strategy combines dual moving average, relative strength index (RSI) and parabolic SAR (PSAR) to identify price reversal points and make buy and sell decisions accordingly. It belongs to reversal trading strategies.
Principles
The strategy mainly uses the following technical indicators to determine price reversal points:
-
Dual Moving Average: Calculate fast moving average (MA fast line) and slow moving average (MA slow line). When the fast line crosses above the slow line, it indicates a bull market and goes long. When the fast line crosses below the slow line, it indicates a bear market and goes short.
-
RSI Indicator: RSI judges overbought and oversold conditions by calculating the average closing gain and average closing loss over a period of time. RSI above 70 indicates overbought zone and below 30 indicates oversold zone.
-
PSAR Indicator: Parabolic SAR indicates the trend direction. SAR points below price indicate bull market and above price indicate bear market.
-
ADX Indicator: ADX measures the strength of a trend by calculating the directional movement. ADX above 20 signals a trending market and below 20 signals consolidation.
The logic for buy and sell signals is as follows:
Buy Signal: Fast MA crosses above slow MA, RSI below 30 (oversold), SAR points above price, ADX above 20.
Sell Signal: Fast MA crosses below slow MA, RSI above 70 (overbought), SAR points below price, ADX above 20.
When buy or sell signal occurs, take a position with 10% of equity respectively. Close position timely when reversal signal fails.
Advantages
-
Dual MAs determine major trend direction, with RSI and SAR filtering false signals, which can accurately identify reversal points.
-
Combining multiple indicators prevents wrong signals from a single indicator.
-
Stop loss avoids excessive risks.
-
Simple and clear logic makes it easy to implement.
-
It works for both uptrend and downtrend.
Risks and Solutions
-
Dual MAs may have false breakout. Consider longer MA periods or adding Bollinger Bands to confirm true breakout.
-
RSI may generate wrong signals if not properly set. Fine tune RSI parameters and add other indicators to confirm RSI signals.
-
Suspend trading when ADX is below 20 to avoid reversal trading in directionless markets. Or shorten ADX period.
-
SetStringry stop loss may cause unnecessary loss. Set reasonable stop loss based on market volatility.
-
High trading frequency. Adjust MA periods to lower trading frequency.
Improvement
-
Test different MA periods to find the optimal combination.
-
Test different RSI parameters for better overbought/oversold judgement.
-
Add other indicators like Bollinger Bands, KDJ to enrich logic.
-
Set dynamic stop loss based on different products and markets.
-
Add position sizing to better follow trends.
-
Test different ADX parameters to find the best value to determine trend strength.
-
Add auto stop loss function.
Conclusion
This strategy identifies major trend direction using dual MAs, and uses RSI, SAR for additional signal filtering. It can effectively determine reversal points after parameter optimization, and catch trends around reversals. In practice, risk management by proper stop loss, and ongoing parameter optimization are important. Overall, the strategy combines indicators with clear logic and easy operation, making it a reliable reversal trading strategy.
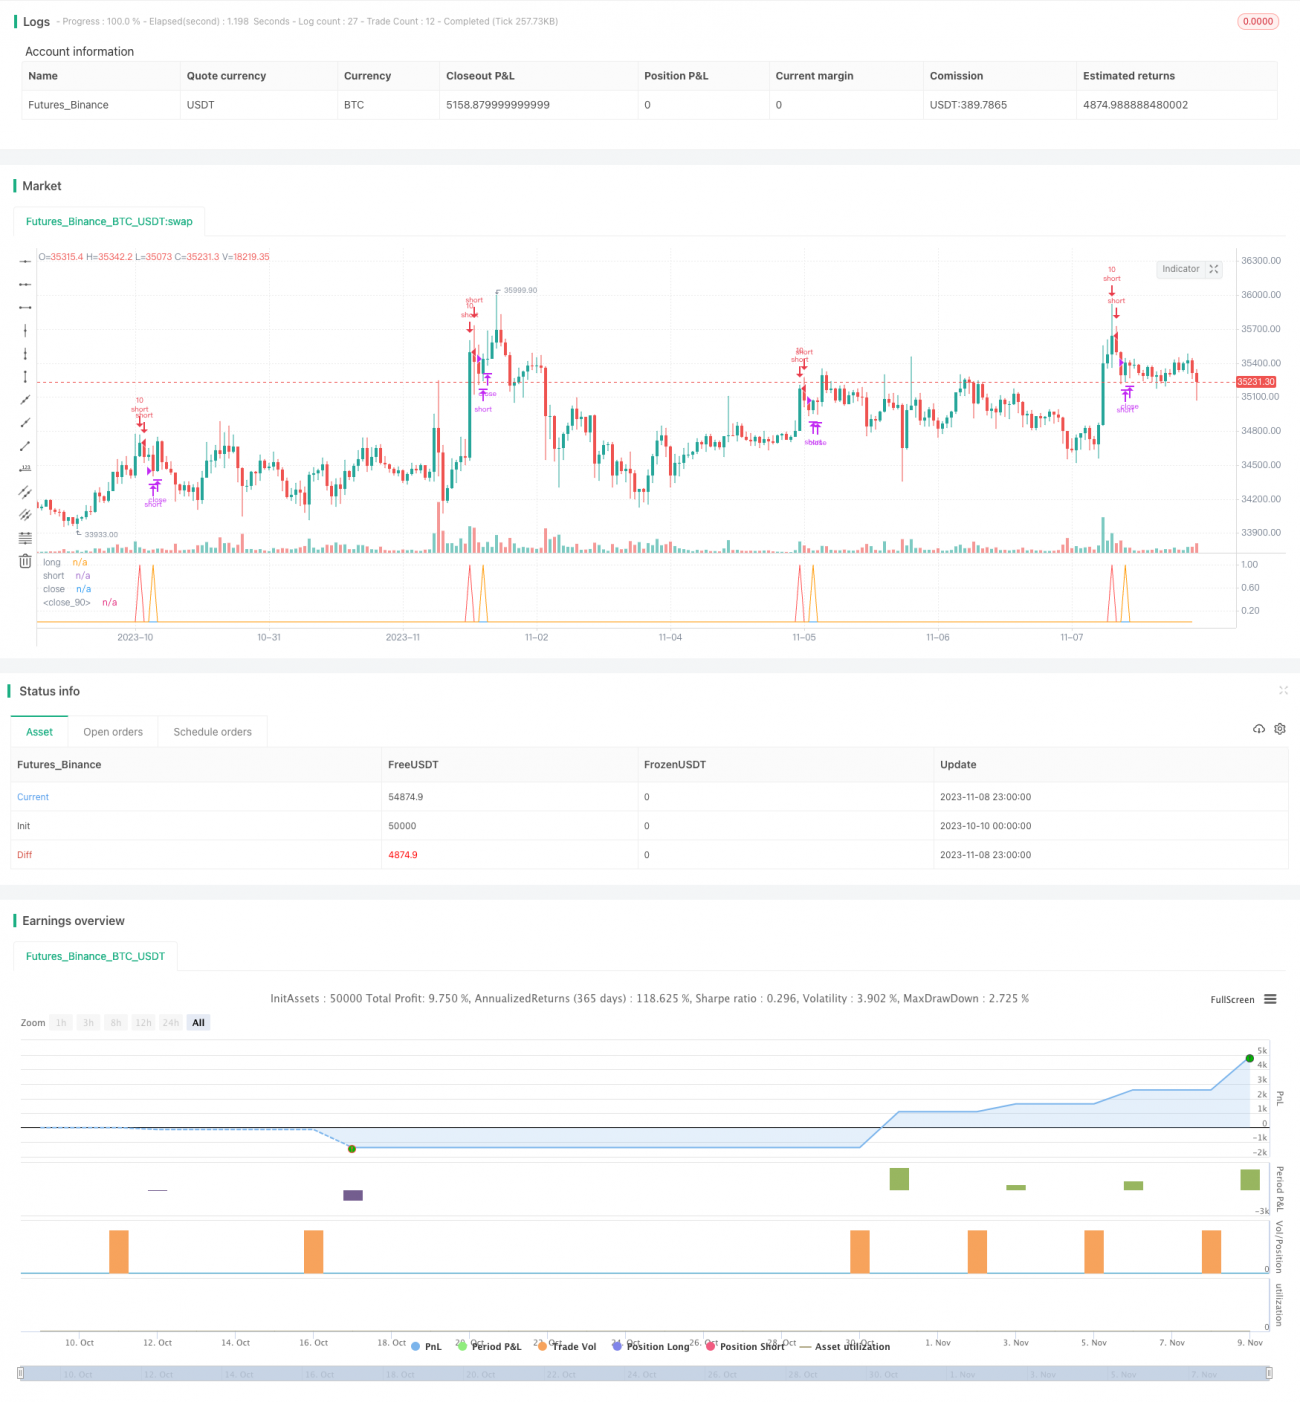
/*backtest
start: 2023-10-10 00:00:00
end: 2023-11-09 00:00:00
period: 1h
basePeriod: 15m
exchanges: [{"eid":"Futures_Binance","currency":"BTC_USDT"}]
*/

//@version=2
//Based on Senpai BO 3
strategy(title="Senpai_Strat_3", shorttitle="Senpai_Strat_3", overlay=false, default_qty_type=strategy.percent_of_equity, default_qty_value=100)
src = close- 1