Dynamic Channel Breakout Strategy

Overview
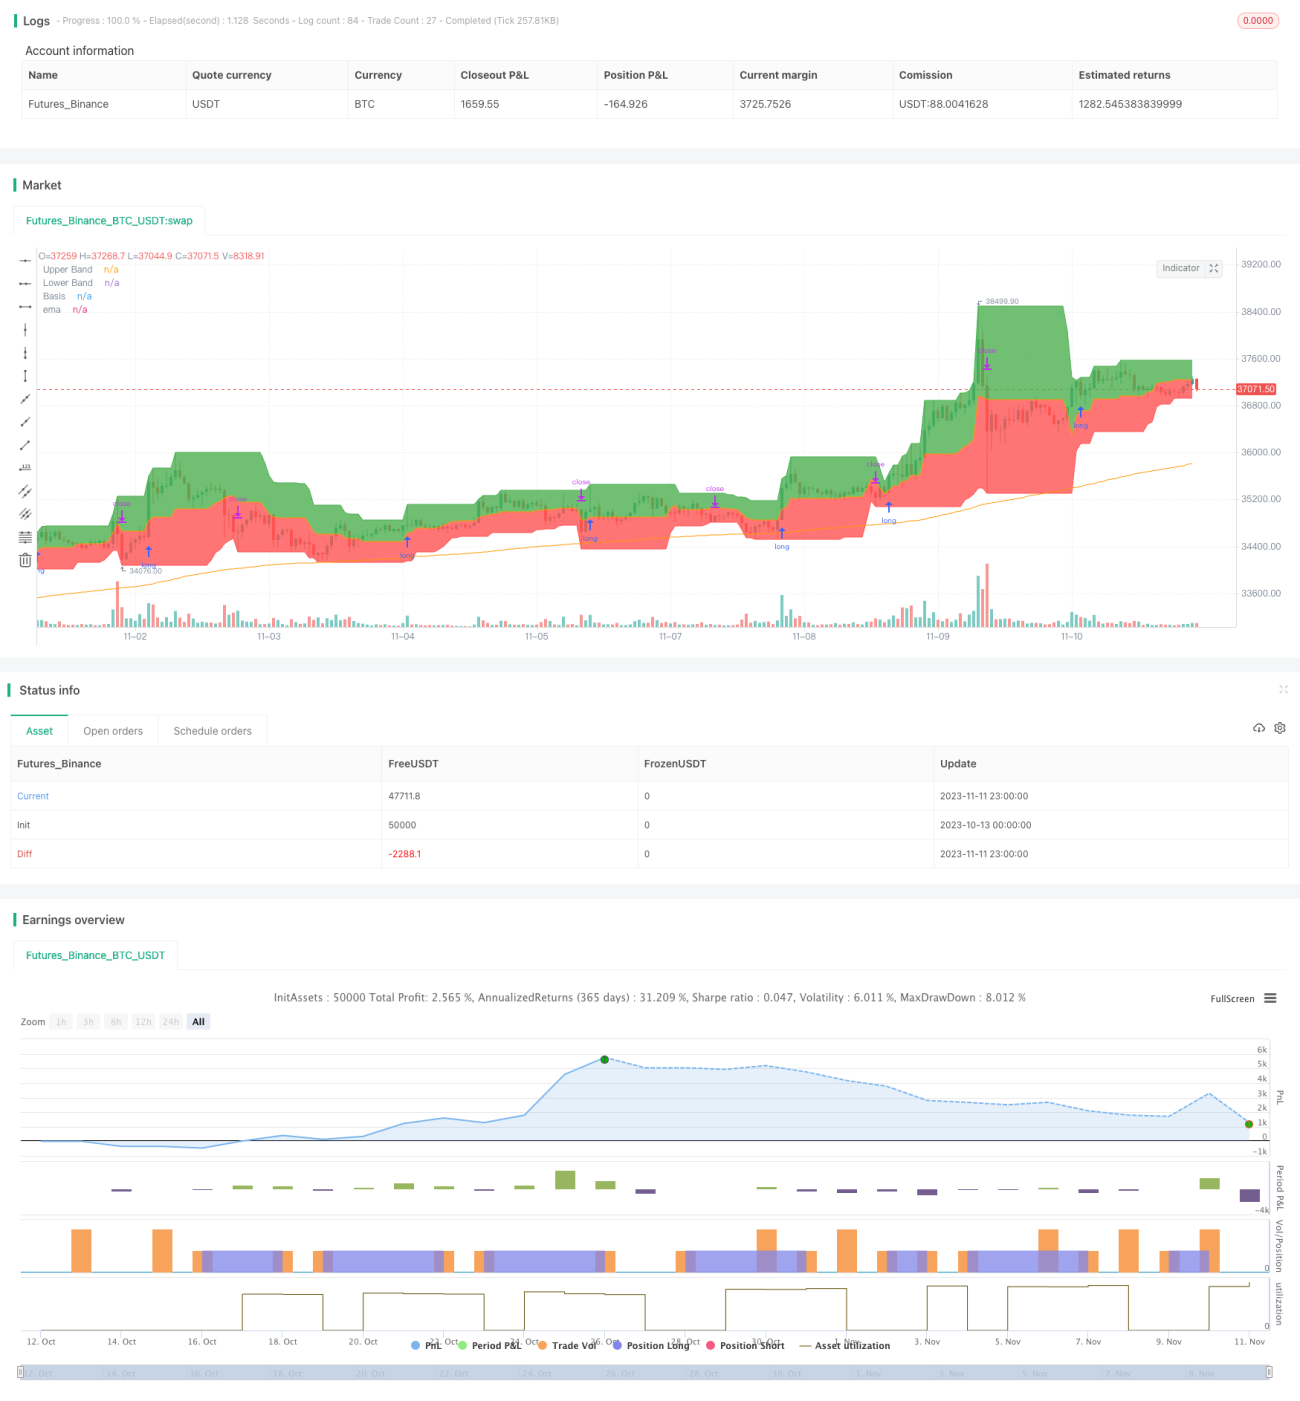
This strategy utilizes the dynamic channel indicator to determine market direction based on channel breakouts, aiming to capture trend directionality. It mainly calculates the highest high and lowest low over a certain period to form upper and lower channels, generating trading signals when the price breaks through the channels.
Strategy Logic
The strategy uses the input function to set the channel period length to 20 days. It then calculates the highest high over the past 20 days as the upper band, and the lowest low over the past 20 days as the lower band.
The channel is filled with color. The area above the upper band is filled with green, and the area below the lower band is filled with red, forming a dynamic channel.
The 200-day moving average ema(close,200) is also plotted as a reference to determine the overall trend.
The strategy uses the ema as the benchmark to judge the major trend. When close is above the 200-day line, it indicates an uptrend. When close is below, it indicates a downtrend.
In an uptrend, if the closing price close breaks through the upper band, a long signal is generated. In a downtrend, if close breaks the lower band, a short signal is generated.
The long stop loss is set at the lower band or middle line based on the long/short rules. The short stop loss is set at the upper band or middle line.
Advantage Analysis
-
The dynamic channel adapts to changing market trends.
-
Trading signals are generated based on breakouts, following the trend trading principle.
-
The major trend is determined by moving average, combined with channel breakouts.
-
Flexible stop loss placement based on market conditions.
Risk Analysis
-
Wrong judgement of the major trend may deviate from the market.
-
Improper channel period setting increases incorrect trading.
-
Stop loss being too close to the channel may increase being stopped out.
-
Breakout signals have some lag, possibly missing the best entry point.
Solutions:
-
Use multiple indicators to judge the major trend, reducing errors.
-
Optimize channel period parameters for different market rhythms.
-
Adjust stop loss position to have enough buffer.
-
Add filters to screen entry signals.
Optimization Directions
-
Add more indicators to judge the major trend, improving accuracy.
-
Incorporate volume indicators to avoid false breakouts.
-
Optimize channel period parameters for different products.
-
Implement dynamic trailing stop loss.
-
Add filters to improve signal quality and avoid unnecessary trades.
Conclusion
This strategy follows the trend trading principle overall, using dynamic channels to determine volatility range and generating signals from breakouts. It can effectively track trend changes and is a reliable trend following strategy. But major trend judgement and stop loss mechanisms need further optimization and filtering conditions should be added to improve robustness. The strategy suits mid-to-long term trend tracking, and can be combined with other strategies in a portfolio to hedge risks.
- 1