Bollinger Band Breakout Strategy

Author: ChaoZhang, Date: 2023-11-13 11:26:50
Tags:

img

Overview

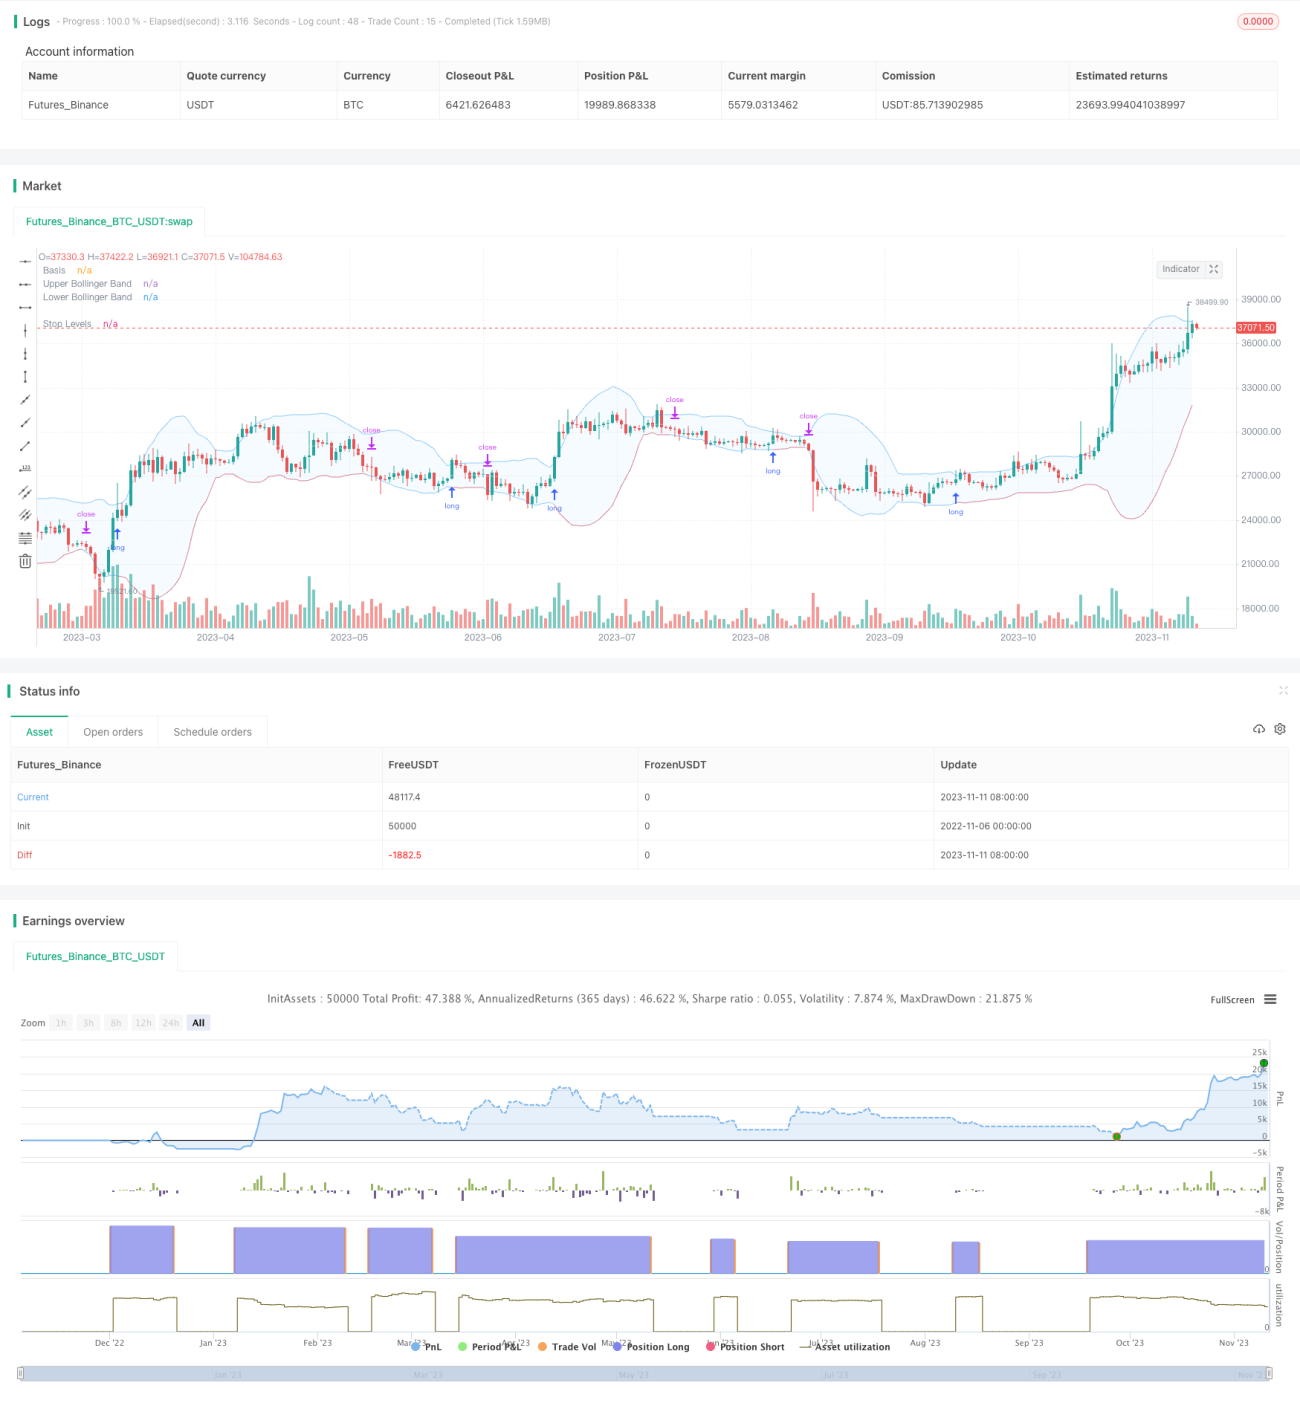
This strategy utilizes the dynamic upper and lower bands of Bollinger Bands to go long when the price breaks above the upper band and close position when the price falls below the lower band. Unlike traditional breakout strategies with fixed levels, the bands of Bollinger Bands change dynamically based on historical volatility, making it better at identifying overbought and oversold conditions.

Strategy Logic

The strategy relies primarily on the Bollinger Bands indicator to identify breakouts. The Bollinger Bands consist of three lines:

  1. Middle Line: n-period moving average
  2. Upper Band: Middle Line + k * n-period standard deviation
  3. Lower Band: Middle Line - k * n-period standard deviation

When the price rises above the upper band, the market is considered overbought, and a long position can be initiated. When the price falls below the lower band, the market is oversold, and the position should be closed.

The strategy allows customization of the Bollinger Bands parameters: the moving average period n and the standard deviation multiplier k. The default values are 20 periods for the moving average and 2 for the standard deviation multiplier.

The strategy checks if the closing price breaks above the upper band after each trading day. If it does, a long signal is triggered on the next day’s opening. Once long, the strategy monitors if the price breaks below the lower band in real-time and closes the position if it does.

The strategy also incorporates a moving average filter that only generates buy signals when the price is above the moving average line. The moving average can be set on the current or higher timeframe to better control entry timing.

Two stop loss choices are provided: fixed percentage stop loss or trailing the lower band. The latter gives more room for profits to run.

Advantages of the Strategy

  • Utilize Bollinger Bands to judge overbought/oversold levels
  • Moving average filter avoids trading against the trend
  • Customizable Bollinger Bands parameters suit different periods
  • Choice between two stop loss methods
  • Backtesting allows parameter optimization and out-of-sample verification

Risks of the Strategy

  • Bollinger Bands cannot fully determine overbought/oversold
  • Moving average filter may miss faster breakouts
  • Fixed stop loss can be too conservative, trailing stop may be too aggressive
  • Parameters need optimization for different products and timeframes
  • Unable to limit loss size, need to consider money management

Optimization Directions

  • Test different moving average parameter combinations
  • Try different Bollinger Bands parameters
  • Compare fixed percentage stop loss vs trailing lower band in terms of return
  • Add money management module to limit per trade loss
  • Incorporate other indicators to confirm Bollinger Bands signal

Conclusion

The strategy identifies overbought/oversold conditions using Bollinger Bands’ dynamic bands, refers to moving average filters, and uses stops to protect capital. Compared to traditional fixed-level breakouts, it adapts better to market fluctuations. With further parameter optimization and risk controls, the strategy can achieve higher stability and returns. Overall, by utilizing the dynamic nature of Bollinger Bands, the strategy captures the strengths of breakout strategies and is worth live trading and long-term optimization.


/*backtest
start: 2022-11-06 00:00:00
end: 2023-11-12 00:00:00
period: 1d
basePeriod: 1h
exchanges: [{"eid":"Futures_Binance","currency":"BTC_USDT"}]
*/

//@version=5

// Revision:        1
// Author:          @millerrh
// Strategy:  
//      Entry: Buy when price breaks out of upper Bollinger Band
//      Exit: Trail a stop with the lower Bollinger Band 
// Conditions/Variables:
//    1. Can add a filter to only take setups that are above a user-defined moving average on current timeframe and/or longer timeframe (helps avoid trading counter trend) 
//    2. Manually configure which dates to back test
//    3. User-Configurable Bollinger Band Settings
//    4. Optionally use a tighter initial stop level.  Once Bollinger Band catches up, trail with lower Bollinger Band to give more breathing room.

// strategy('Donchian Breakout', overlay=true, initial_capital=100000, currency='USD', default_qty_type=strategy.percent_of_equity, calc_on_every_tick = true,
//   default_qty_value=100, commission_type=strategy.commission.percent, commission_value=0.1)

strategy('Bollinger Breakout', overlay=true, initial_capital=100000, currency='USD', default_qty_type=strategy.percent_of_equity,
  default_qty_value=100, commission_type=strategy.commission.percent, commission_value=0.0, calc_on_order_fills=true)

// === BACKTEST RANGE ===
Start = input(defval = timestamp("01 Jan 2019 06:00 +0000"), title = "Backtest Start Date", group = "backtest window")
Finish = input(defval = timestamp("01 Jan 2100 00:00 +0000"), title = "Backtest End Date", group = "backtest window")

// == INPUTS ==
// Bollinger Band Inputs
bbLength = input.int(20, minval=1, group = "Bollinger Band Settings", title="Bollinger Band Length",
  tooltip = "Bollinger Band moving average length.")
bbMultTop = input.float(2.0, minval=0.001, maxval=50, title="Standard Deviation (Top)")
bbMultBot = input.float(2.0, minval=0.001, maxval=50, title="Standard Deviation (Bottom)")

useTightStop = input.bool(title='Use Fixed Percentage for Initial Stop?', defval=false, group = "order entry",
  tooltip = "'Keep your losers small and let winners run' is the saying.  This will allow you to use a tight initial stop
  until the lower Bollinger Band catches up.")
percStop = input.int(title="Stop", defval=8, group = "order entry", inline = "perc")
trigInput = input.string(title='Execute Trades On...', defval='Wick', options=['Wick', 'Close'], group = "order entry",
  tooltip = "Useful for comparing standing stop orders at the Bollinger Band boundary (executing on the wick) vs. waiting for candle closes prior to taking action")

// Moving Average Filtering Inputs
useMaFilter = input.bool(title='Use Moving Average for Filtering (Current Timeframe)?', defval=false, group = "moving average filtering",
  tooltip = "Signals will be ignored when price is under this moving average.  The intent is to keep you out of bear periods and only buying when 
             price is showing strength.")
maType = input.string(defval='SMA', options=['EMA', 'SMA'], title='MA Type For Filtering', group = "moving average filtering")
maLength = input.int(defval=50, title="Moving Average:    Length", minval=1, group = "moving average filtering", inline = "1ma")
ma1Color = input.color(color.new(color.green, 50), title = " Color", group = "moving average filtering", inline = "1ma")
useMaFilter2 = input.bool(title='Use Moving Average for Filtering (High Timeframe)?', defval=false, group = "moving average filtering")
tfSet = input.timeframe(defval="D", title="Timeframe of Moving Average", group = "moving average filtering",
  tooltip = "Allows you to set a different time frame for a moving average filter.  Trades will be ignored when price is under this moving average.
  The idea is to keep your eye on the larger moves in the market and stay on the right side of the longer term trends and help you be pickier about 
  the stocks you trade.")
ma2Type = input.string(defval='SMA', options=['EMA', 'SMA'], title='MA Type For Filtering', group = "moving average filtering")
ma2Length = input.int(defval=50, title="Moving Average:    Length", minval=1, group = "moving average filtering", inline = "2ma")
ma2Color = input.color(color.new(color.white, 50), title = " Color", group = "moving average filtering", inline = "2ma")


// === THE BOLLINGER BAND ===
// Logic
bbBasis = ta.sma(close, bbLength)
bbUpper = bbBasis + bbMultTop * ta.stdev(close, bbLength)
bbLower = bbBasis - bbMultBot * ta.stdev(close, bbLength)

// Plotting
plot(bbBasis, "Basis", color=color.new(color.white, 50))
p1 = plot(bbUpper, color=color.new(color.blue, 50), linewidth=1, title='Upper Bollinger Band')
p2 = plot(bbLower, color=color.new(color.blue, 50), linewidth=1, title='Lower Bollinger Band')
fill(p1, p2, title = "Background", color=color.rgb(33, 150, 243, 95))

// == FILTERING LOGIC ==
// Declare function to be able to swap out EMA/SMA
ma(maType, src, length) =>
    maType == 'EMA' ? ta.ema(src, length) : ta.sma(src, length)  //Ternary Operator (if maType equals EMA, then do ema calc, else do sma calc)
maFilter = ma(maType, close, maLength)
maFilter2 = request.security(syminfo.tickerid, tfSet, ma(ma2Type, close, ma2Length))

// Plotting
plot(useMaFilter ? maFilter : na, title='Trend Filter MA - CTF', color=ma1Color, linewidth=2, style=plot.style_line)
plot(useMaFilter2 ? maFilter2 : na, title='Trend Filter MA - HTF', color=ma2Color, linewidth=2, style=plot.style_line)


// == ENTRY AND EXIT CRITERIA ==
// Trigger stop based on candle close or High/Low (i.e. Wick)
trigResistance = trigInput == 'Close' ? close : trigInput == 'Wick' ? high : na
trigSupport = trigInput == 'Close' ? close : trigInput == 'Wick' ? low : na
buySignal = trigResistance >= bbUpper 

buyConditions = (useMaFilter ? bbUpper > maFilter : true) and
  (useMaFilter2 ? bbUpper > maFilter2 : true) 
  
// == STOP AND PRICE LEVELS ==
// Configure initial stop level
inPosition = strategy.position_size > 0
stopLevel = strategy.position_avg_price - (strategy.position_avg_price * percStop/100)
posStop = stopLevel > bbLower ? stopLevel : bbLower


// Check if using stop vs. not
stop = useTightStop ? posStop : bbLower
plot(inPosition ? stop : na, style=plot.style_linebr, color=color.new(color.red, 40), linewidth = 1, title = "Stop Levels", trackprice=false)

sellSignal = trigSupport <= stop

// == STRATEGY ENTRIES & EXITS ==
// This string of code enters and exits at the candle close
if trigInput == 'Close'
    strategy.entry('Long', strategy.long, when=buyConditions and buySignal)
    strategy.close('Long', when=sellSignal)

// This string of code enters and exits at the wick (i.e. with pre-set stops)
if trigInput == 'Wick'
    strategy.entry('Long', strategy.long, stop=bbUpper, when=buyConditions)
    strategy.exit('Exit Long', from_entry='Long', stop=stop)
strategy.cancel('Long',when= not(buyConditions)) // Resets stop level once buyConditions aren't true anymore


More