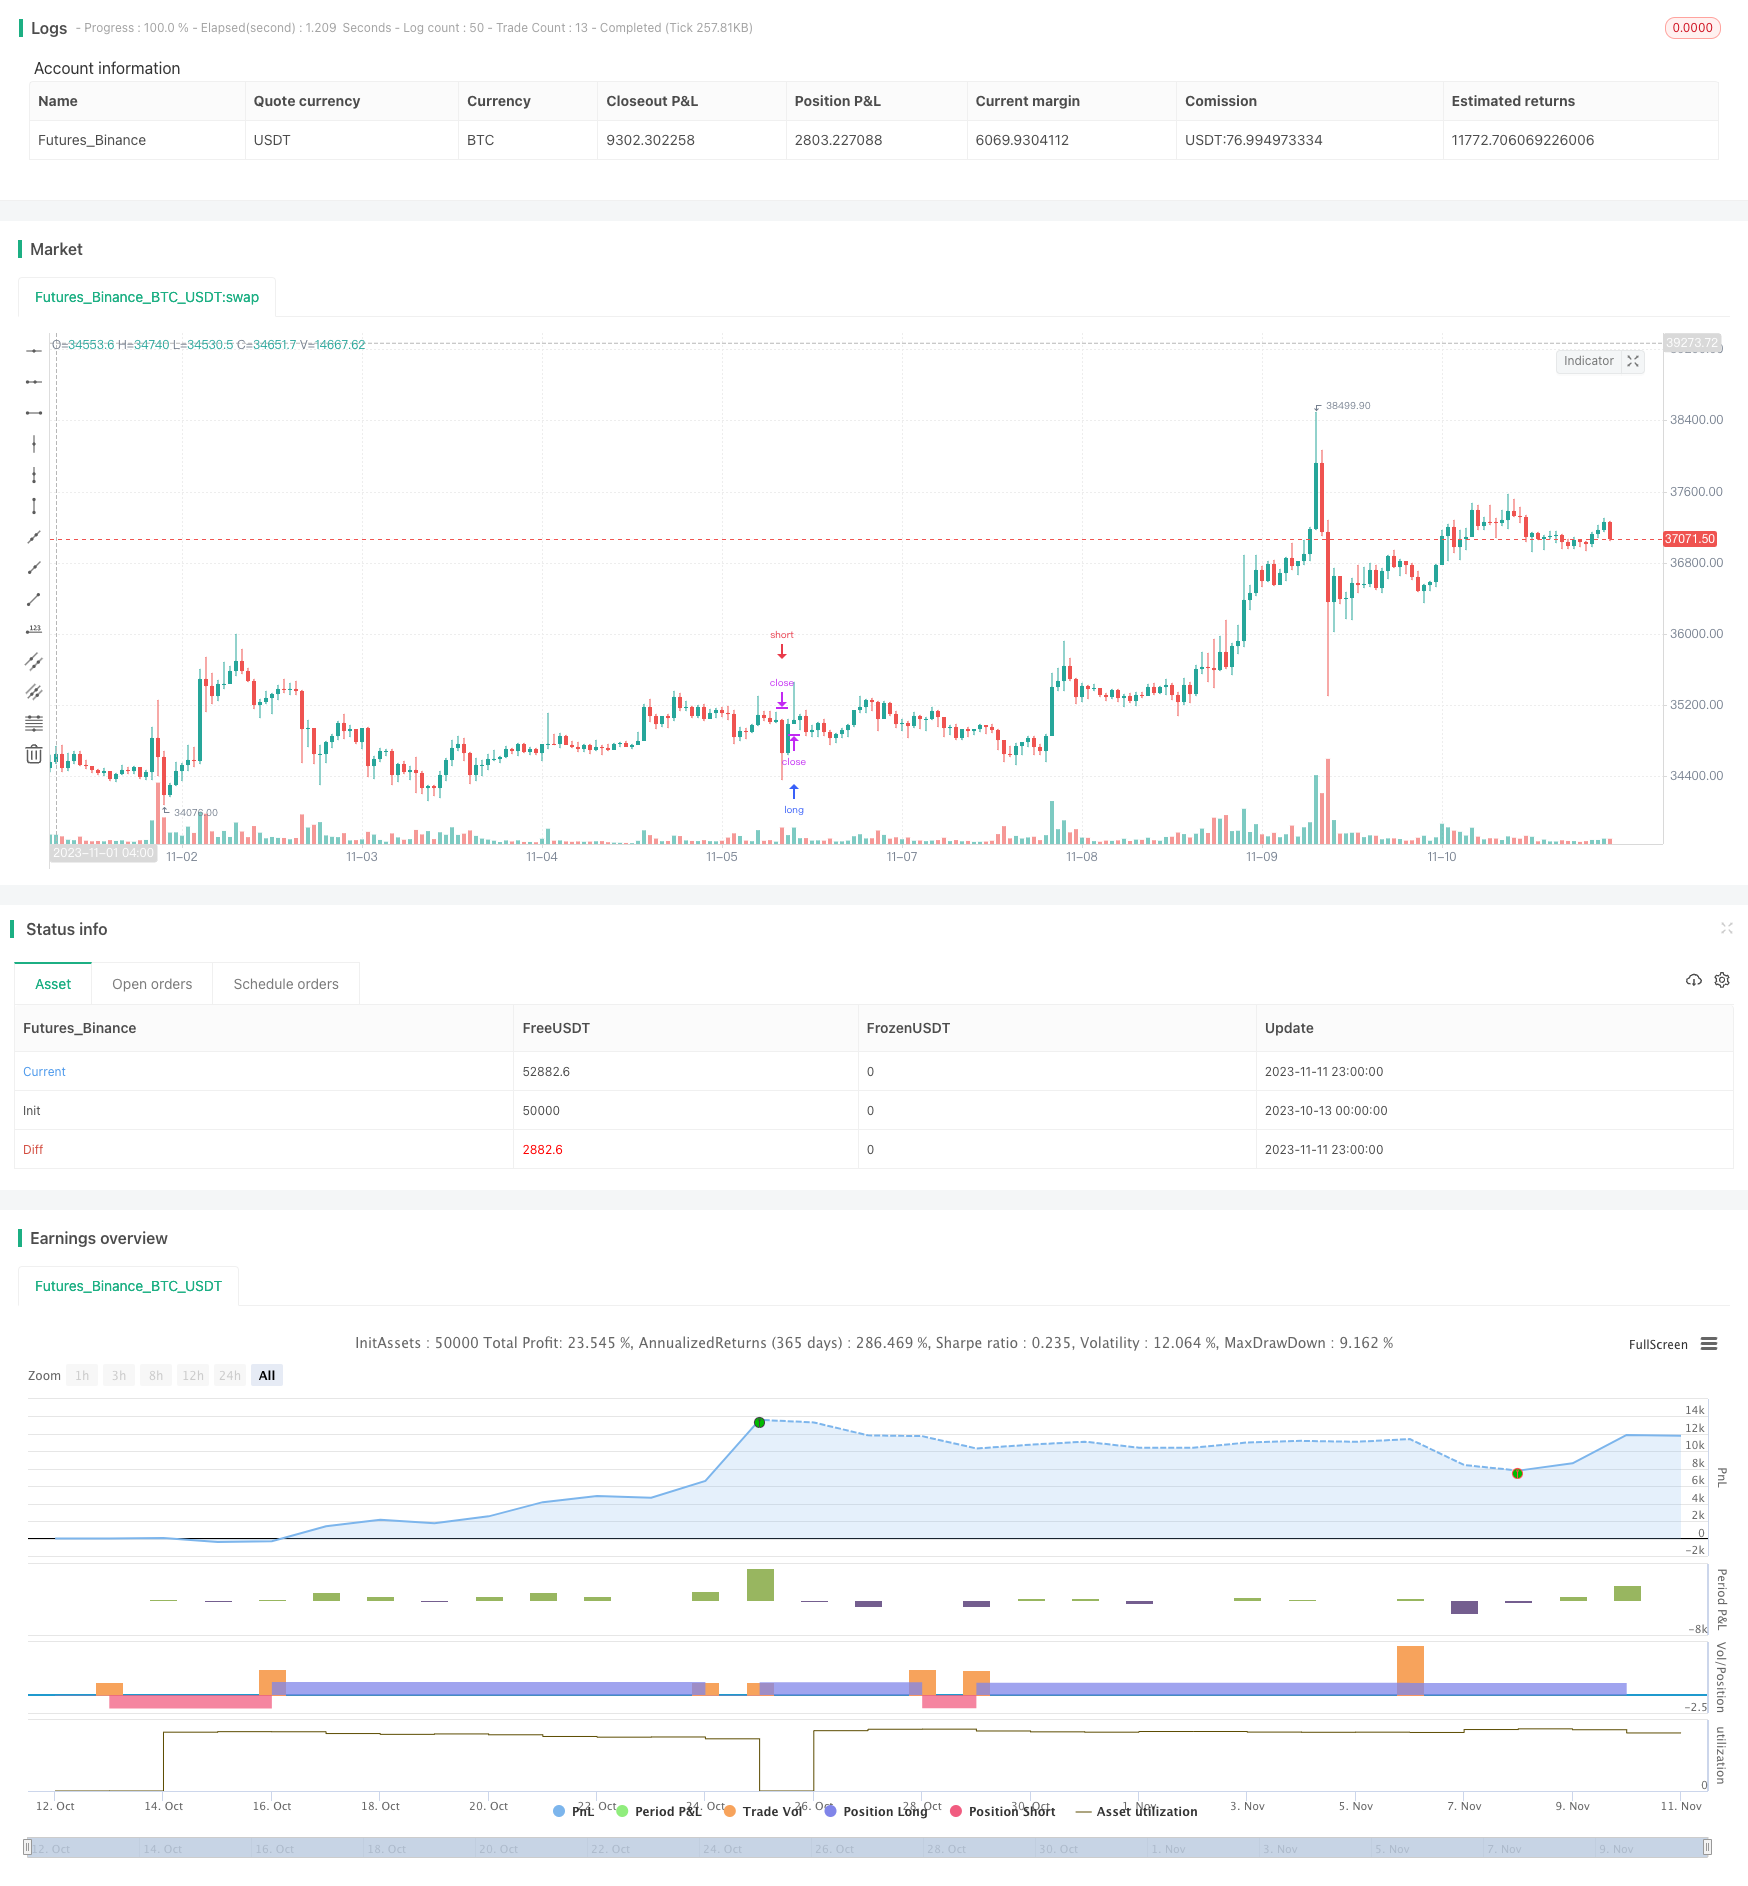
概述
这个策略利用多种指标组合判断趋势方向和交易时机,采用压力平衡的方法提高交易胜率。主要使用MACD,PSAR和EMA三个指标进行判断,结合止损止盈实现高效盈利。
策略原理
使用EMA计算均线,判断整体趋势方向。EMA值较大代表目前处于上升趋势,EMA值较小代表目前处于下降趋势。
使用MACD计算快线和慢线的差值,当差值大于0代表目前处于上升趋势,当差值小于0代表目前处于下降趋势。
使用PSAR计算连续变动点,当PSAR值较大代表目前处于下降趋势,当PSAR值较小代表目前处于上升趋势。
结合上述三个指标,判断趋势一致性。当三个指标判断结果一致时,代表趋势较为明确,可以进行买入或卖出操作。
根据买入和卖出条件开仓,并设置止损止盈点,在达到止损或止盈条件时平仓,实现盈利。
具体操作规则如下:
- 买入条件:非上升趋势,MACD差值小于0,收盘价高于EMA均线
- 卖出条件:上升趋势,MACD差值大于0,收盘价低于EMA均线
- 止损条件:价格触及下一个PSAR值
- 止盈条件:达到设定的止盈比例
策略优势
使用多种指标判断趋势,提高判断准确性。
采用压力平衡方式,在趋势明确时开仓,增加获利概率。
设定止损止盈点,可以限制亏损,锁定盈利。
交易规则清晰系统,适合程序化交易。
可以通过参数优化,调整适应不同品种和交易周期。
策略风险
趋势判断存在错误的可能,导致开仓方向错误。
市场出现剧烈变动,指标发出虚假信号的可能。
止损点设置过大,无法及时止损。
参数设置不当,导致过于频繁交易或无法及时开仓。
交易品种流动性不足,无法按计划止损止盈。
可以通过优化参数,调整止损止盈点,选择流动性好的交易品种来降低风险。
策略优化方向
调整EMA周期参数,优化判断趋势的准确性。
调整MACD快线慢线周期参数,优化MACD指标的敏感性。
调整止损止盈比例参数,取得止损止盈的最佳平衡。
添加其他辅助指标,提高开仓时机选择的准确性。
优化交易品种选择,选择流动性好、波动较大的品种。
调整交易时间周期,适应不同品种的行情特点。
总结
这个策略综合运用多种指标判断趋势,在趋势明确时开仓,并设置止损止盈,可以有效把握市场走势,在保证一定盈利的前提下获取比较理想的回报。通过参数优化和加入其他辅助指标,可以进一步提高策略的稳定性和盈利水平。该策略交易规则清晰易懂,非常适合程序化交易。
/*backtest
start: 2023-10-13 00:00:00
end: 2023-11-12 00:00:00
period: 1h
basePeriod: 15m
exchanges: [{"eid":"Futures_Binance","currency":"BTC_USDT"}]
*/

// This source code is subject to the terms of the Mozilla Public License 2.0 at https://mozilla.org/MPL/2.0/
// © exlux99

//@version=4
strategy(title = "Crypto Scalper", overlay = true,  pyramiding=1,initial_capital = 100, default_qty_type= strategy.percent_of_equity, default_qty_value = 100, calc_on_order_fills=false, slippage=0,commission_type=strategy.commission.percent,commission_value=0.03)
len = input(60, minval=1, title="Length EMA")
src = input(close, title="Source")
out = ema(src, len)
//
fast_length = input(title="Fast Length MACD", type=input.integer, defval=12)
slow_length = input(title="Slow Length MACD", type=input.integer, defval=26)
signal_length = input(title="Signal Smoothing", type=input.integer, minval = 1, maxval = 50, defval = 9)
sma_source = input(title="Oscillator MA Type MACD", type=input.string, defval="EMA", options=["SMA", "EMA"])
sma_signal = input(title="Signal Line MA Type MACD", type=input.string, defval="EMA", options=["SMA", "EMA"])

// Calculating
fast_ma = sma_source == "SMA" ? sma(src, fast_length) : ema(src, fast_length)
slow_ma = sma_source == "SMA" ? sma(src, slow_length) : ema(src, slow_length)
macd = fast_ma - slow_ma
signal = sma_signal == "SMA" ? sma(macd, signal_length) : ema(macd, signal_length)
hist = macd - signal


start = input(0.02)
increment = input(0.02)
maximum = input(0.2)
var bool uptrend = na
var float EP = na
var float SAR = na
var float AF = start
var float nextBarSAR = na
if bar_index > 0
	firstTrendBar = false
	SAR := nextBarSAR
	if bar_index == 1
		float prevSAR = na
		float prevEP = na
		lowPrev = low[1]
		highPrev = high[1]
		closeCur = close
		closePrev = close[1]
		if closeCur > closePrev
			uptrend := true
			EP := high
			prevSAR := lowPrev
			prevEP := high
		else
			uptrend := false
			EP := low
			prevSAR := highPrev
			prevEP := low
		firstTrendBar := true
		SAR := prevSAR + start * (prevEP - prevSAR)
	if uptrend
		if SAR > low
			firstTrendBar := true
			uptrend := false
			SAR := max(EP, high)
			EP := low
			AF := start
	else
		if SAR < high
			firstTrendBar := true
			uptrend := true
			SAR := min(EP, low)
			EP := high
			AF := start
	if not firstTrendBar
		if uptrend
			if high > EP
				EP := high
				AF := min(AF + increment, maximum)
		else
			if low < EP
				EP := low
				AF := min(AF + increment, maximum)
	if uptrend
		SAR := min(SAR, low[1])
		if bar_index > 1
			SAR := min(SAR, low[2])
	else
		SAR := max(SAR, high[1])
		if bar_index > 1
			SAR := max(SAR, high[2])
	nextBarSAR := SAR + AF * (EP - SAR)

tplong=input(0.245, step=0.005)
sllong=input(1.0, step=0.005)
tpshort=input(0.055, step=0.005)
slshort=input(0.03, step=0.005)

if (uptrend and hist >0 and close < out)
	strategy.entry("short", strategy.short, stop=nextBarSAR, comment="short")
	strategy.exit("short_tp/sl", "short", profit=close * tpshort / syminfo.mintick, loss=close * slshort / syminfo.mintick, comment='SHORT EXIT',  alert_message = 'closeshort')
if (not uptrend and hist <0 and close > out)
	strategy.entry("long", strategy.long, stop=nextBarSAR, comment="long")
	strategy.exit("short_tp/sl", "long", profit=close * tplong / syminfo.mintick, loss=close * sllong / syminfo.mintick, comment='LONG EXIT',  alert_message = 'closelong')