RSI Oscillator Turtle Trading Short-term Strategy

Overview
This is a short-term trading strategy that uses the RSI indicator based on the turtle trading rules. It combines the RSI indicator and Williams Alligator indicator to take counter-trend trades when the RSI enters the overbought or oversold zone. It's a relatively conservative short-term trading strategy.
Strategy Logic
The strategy is mainly based on the following principles:
-
Using the turtle trading rules, only enter the market when there is an obvious reversal, adopting a relatively conservative trading approach.
-
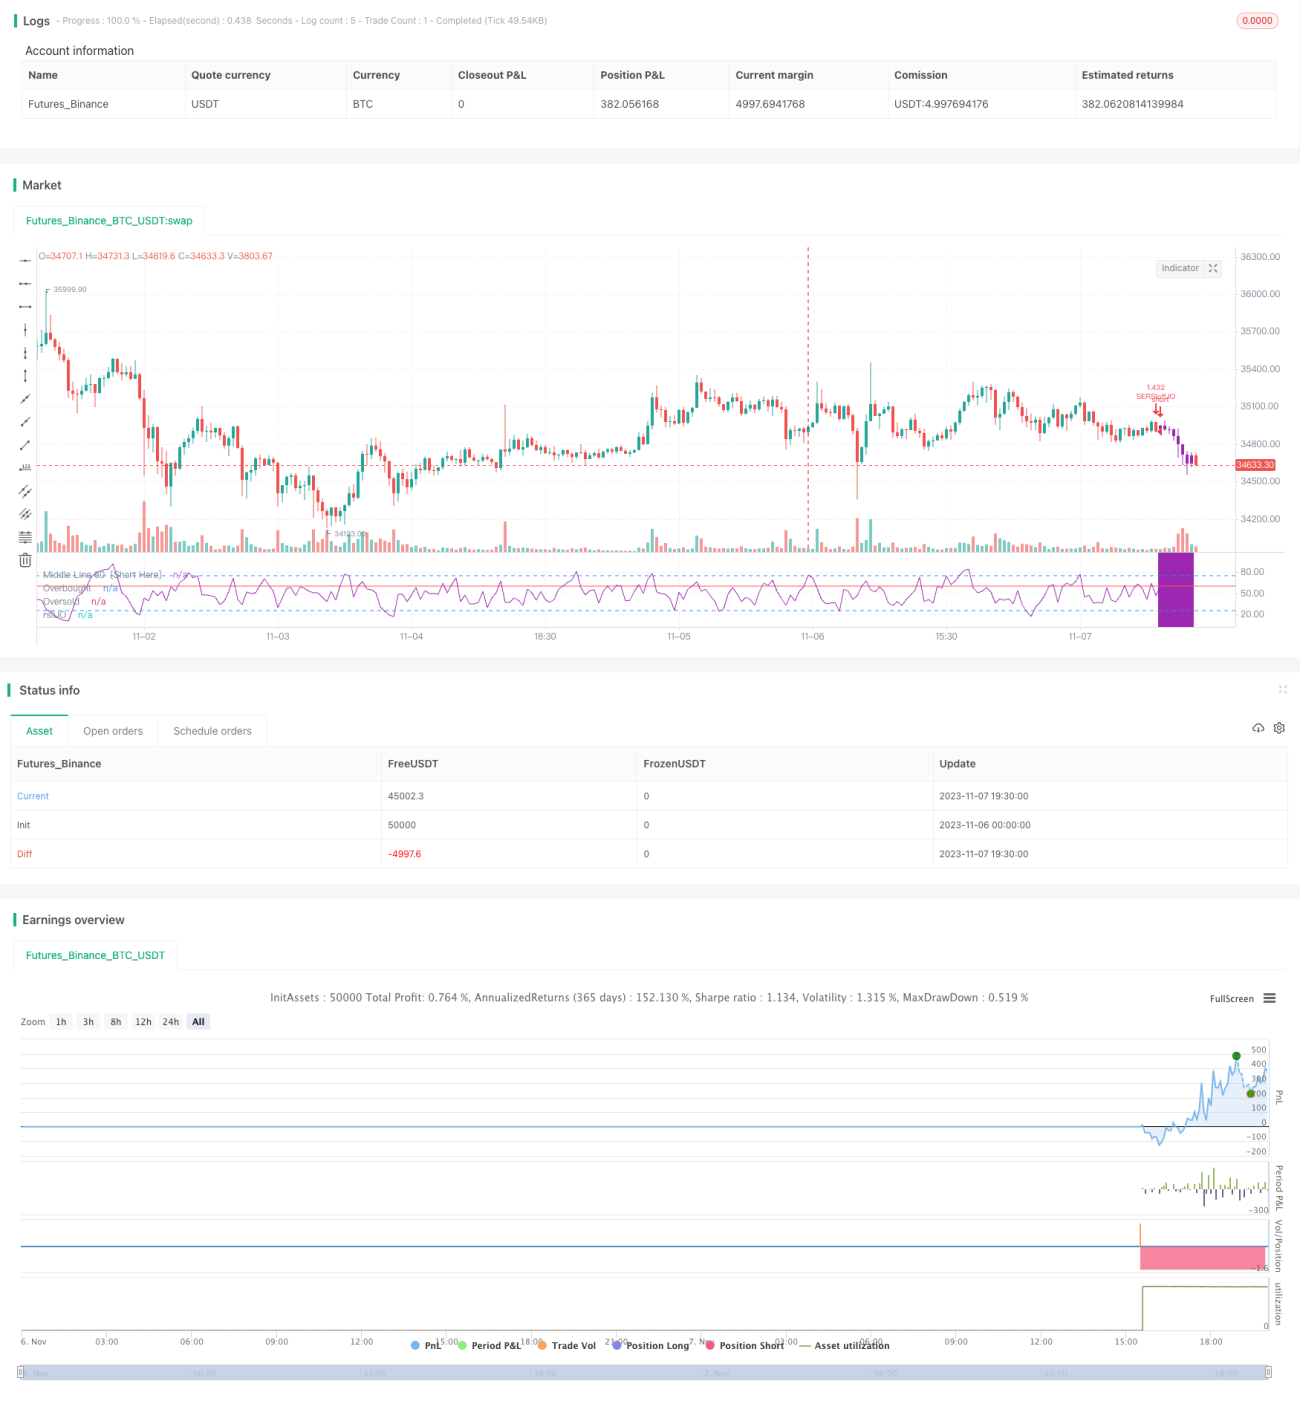
Using the RSI indicator to judge the overbought/oversold conditions. When the RSI line enters the overbought zone (default above 60) or oversold zone (default below 40), it indicates the market is at the reversal point, then take counter-trend trades.
-
Combining the Williams Alligator indicator to determine the market trend. Go short only when the Alligator shows the three lines (Lips, Teeth, Jaw) aligned in a downtrend; go long only when the three lines aligned in an uptrend.
-
Using RSI of RSI to judge the overbought/oversold conditions of the RSI indicator itself, creating a double filter effect. Only when the RSI line enters the overbought/oversold zone, and the RSI of RSI also enters the overbought/oversold zone, will trading signals trigger.
-
Set stop loss and take profit lines. Close the position for profit or stop loss when the price reverses to hit the take profit or stop loss lines.
Advantage Analysis
The strategy has the following advantages:
-
Adopting the robust turtle trading rules, only entering the market when there is an obvious reversal, can avoid huge risks when the market is ranging.
-
Using the RSI indicator to determine market reversal points, the indicator is simple and clear, easy to operate. The RSI of RSI setting avoids whipsaws, and the double filter improves signal reliability.
-
Combining the Alligator indicator to determine the trend direction avoids trading against the trend. The Alligator acts as an additional filter to improve effectiveness.
-
Setting stop loss and take profit locks in profits and controls risks.
-
Easy to optimize parameters. The RSI parameters and entry/exit criteria can be adjusted for different markets to optimize the strategy.
Risk Analysis
The strategy also has some risks:
-
There is a probability of false signals from the RSI indicator. The RSI may give incorrect overbought/oversold signals. Combining Alligator can reduce false signals.
-
A too wide stop loss may lead to enlarged losses. The stop loss should be narrowed appropriately to reduce per trade loss.
-
Reversals may not happen exactly at RSI overbought/oversold zones. Market regime changes may shift the reversal points, parameters should be adjusted accordingly.
-
The number of trades can be low, facing periods of no trading. Entry criteria could be relaxed to increase number of trades.
-
Prolonged trending markets can make short-term trading difficult. Holding period should be adjusted in a timely manner, lengthening or shortening the trading timeframe.
Optimization Directions
The strategy can be optimized in the following aspects:
-
Optimize RSI parameters, adjust the overbought/oversold zones to adapt to different markets.
-
Adjust Alligator parameters to improve the accuracy of determining trend direction.
-
Optimize stop loss and take profit settings to maximize drawdown control and lock in more profits.
-
Combine with other indicators like KDJ, MACD etc. to improve signal accuracy.
-
Add auto stop loss, trailing stop loss to better control single trade loss.
-
Optimize position sizing under different market conditions to manage risks.
-
Optimize trading sessions, trade at times when the trend is more obvious.
Summary
In summary, this is a relatively robust short-term trading strategy. It adopts a conservative turtle trading approach, uses the RSI indicator to determine reversal points, and incorporates the Alligator indicator to judge trend direction, which can effectively avoid high-risk trades like chasing tops and bottoms, and lock in relatively stable profits. By optimizing parameters, stop loss/take profit, combining other indicators, etc., the strategy can be continuously improved. Overall, this strategy suits investors who are interested in counter-trend trading and pursuing steady returns.
- 1