概述
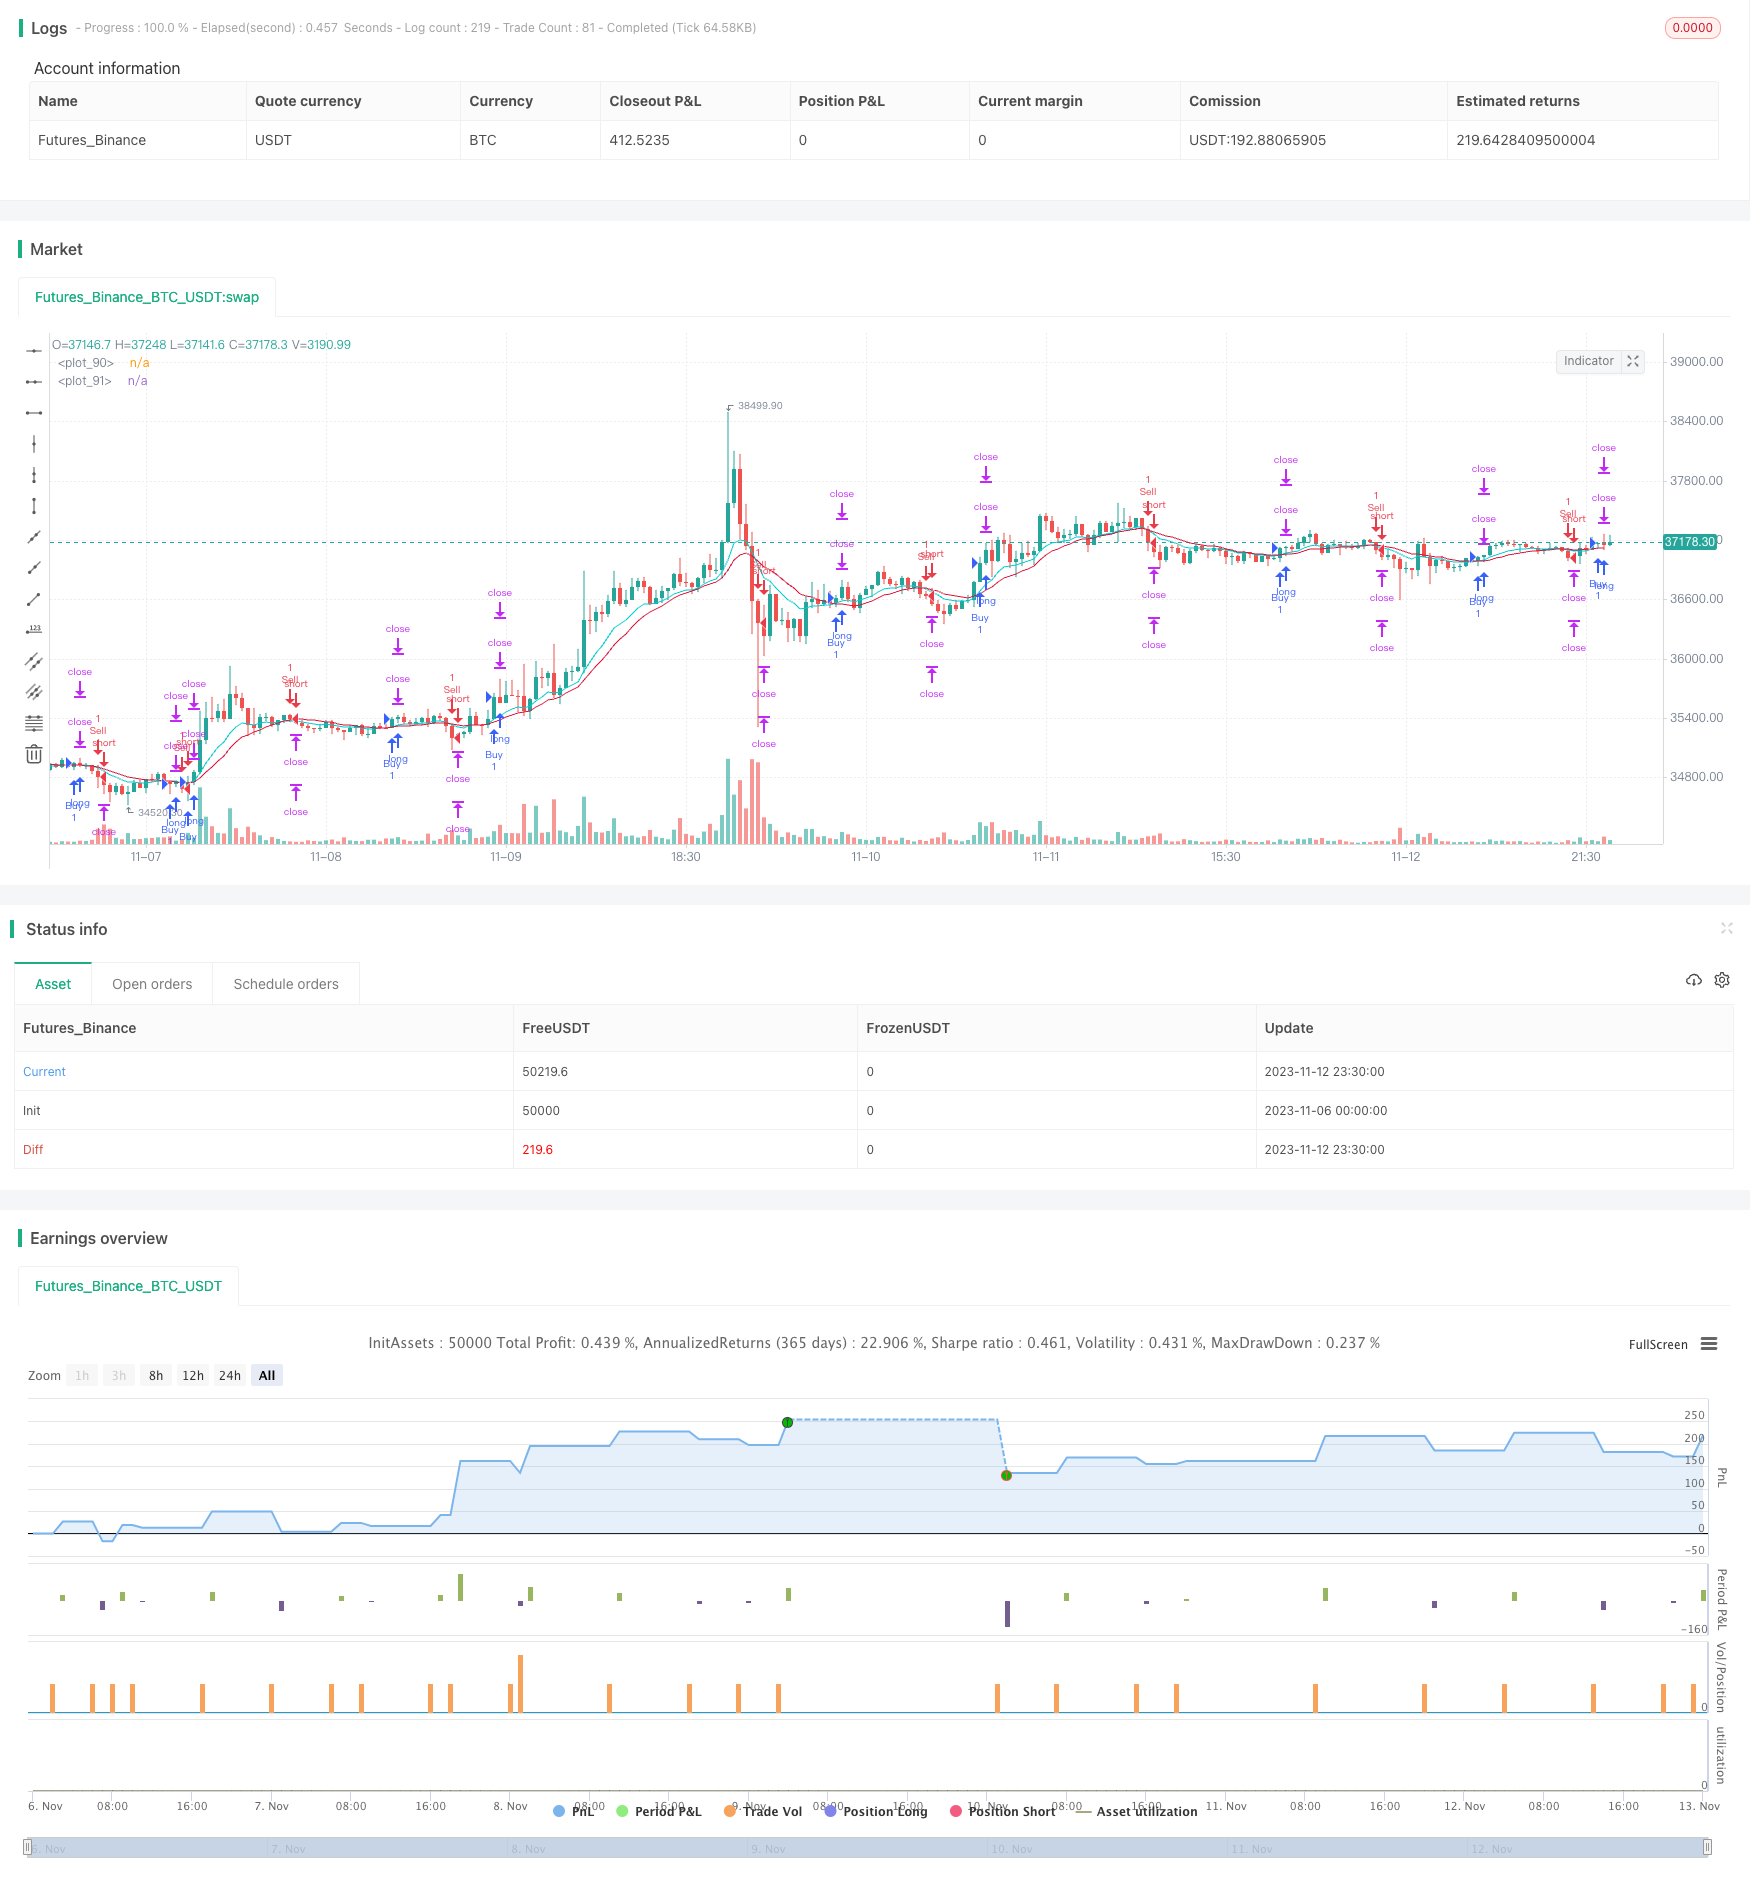
本策略运用了简单移动平均线交叉和双重止盈技巧,旨在控制风险、提高获利概率。策略适合中短期交易,可以在趋势变化时捕捉机会。
策略原理
该策略基于EMA和WMA的交叉来判断行情走势。当EMA上穿WMA时,做多;当EMA下穿WMA时,做空。
每次开仓时,策略会设置两个止盈水平。第一个止盈水平固定为开仓价格+20点,第二个止盈水平固定为开仓价格+40点。同时设置一个止损水平,固定为开仓价格-20点。
当价格触碰第一个止盈水平时,平仓一半头寸。剩余头寸继续持有,追求第二个止盈水平或被止损。
这样,每个交易有三种结果:
价格触发止损,直接亏损2%。
价格先触发第一个止盈,平一半头寸,锁定1%利润,然后继续运行直至被止损,最终收支平衡,零利润。
价格触发第一个止盈后继续运行,再触发第二个止盈,最终获得1%+2%=3%的盈利。
优势分析
这种双盈止损策略最大的优势是可以控制风险,避免单次大亏损。当行情不利时,止损可以把损失控制在2%以内。当行情阳光时,两个止盈水平可以获取较大利润。
相比单一止盈止损,该策略有三种结果:亏损、盈利和不亏不赚,降低了止损的概率。即使止损,最大损失也控制在2%。相比传统止盈止损策略,这种双盈止损策略可显著降低DD和提高胜率。
另一个优势是操作简单。EMA和WMA都是广为人知的指标,容易理解。止盈止损逻辑非常清晰,可以方便监控。这让策略容易被量化交易初学者接受和实施。
风险分析
尽管该策略有一定优势,也存在一些风险需要关注。
首先,EMA和WMA作为均线指标,对震荡行情识别能力较弱。当趋势不明显时,可能产生较多错信号,导致过于频繁交易。
其次,固定的止盈止损点位可能与市场波动不匹配。当波动较大时,止盈止损可能会被突破,无法起到保护作用。
最后,该策略无法响应突发事件,存在被套利的风险。重大新闻事件发生时,行情可能出现大幅跳空,直接击穿止盈止损线,造成较大亏损。
优化方向
可以从以下几个方面进一步优化该策略:
改进进入信号。可以尝试比EMA和WMA更优秀的均线指标或趋势指标,提高信号质量。
动态调整止盈止损位。可以根据ATR、移动止损等方式实时调整止盈止损点位,使其能动态跟随市场。
增加过滤条件。可以在金叉前添加交易量或者副指标的确认,避免被套。也可以根据重大事件日历选择是否交易。
优化仓位管理。可以根据资金管理原则优化每次交易的具体仓位大小。
总结
本策略总体来说是一个简单实用的趋势跟踪策略。它使用EMA和WMA形成交易信号,并采用双重止盈技巧控制风险。相比传统策略,具有获利概率更高、风险更低的优势。当然,也需要注意指标局限性和止盈止损设置的风险。通过进一步优化,可以使该策略更稳定可靠。
/*backtest
start: 2023-11-06 00:00:00
end: 2023-11-13 00:00:00
period: 30m
basePeriod: 15m
exchanges: [{"eid":"Futures_Binance","currency":"BTC_USDT"}]
*/

//@version=4
strategy("FS ATR & PS (MA)", overlay=true)

// Strategy
Buy  = input(true)
Sell = input(true)

// Time Period
start_year   = input(title='Start year'   ,defval=2019)
start_month  = input(title='Start month'  ,defval=1)
start_day    = input(title='Start day'    ,defval=1)
start_hour   = input(title='Start hour '  ,defval=0)
start_minute = input(title='Start minute' ,defval=0)
end_time     = input(title='set end time?',defval=false)
end_year     = input(title='end year'     ,defval=2019)
end_month    = input(title='end month'    ,defval=12)
end_day      = input(title='end day'      ,defval=31)
end_hour     = input(title='end hour'     ,defval=23)
end_minute   = input(title='end minute'   ,defval=59)

// MA
ema_period   = input(title='EMA period',defval=10)
wma_period   = input(title='WMA period',defval=20)
ema = ema(close,ema_period)
wma = wma(close,wma_period)

// Entry Condition
longCondition  =
 crossover(ema,wma) and Buy and
 nz(strategy.position_size) == 0 and
 time > timestamp(start_year, start_month, start_day, start_hour, start_minute) and
 (end_time?(time < timestamp(end_year, end_month, end_day, end_hour, end_minute)):true)

shortCondition =
 crossunder(ema,wma) and Sell and
 nz(strategy.position_size) == 0 and
 time > timestamp(start_year, start_month, start_day, start_hour, start_minute) and
 (end_time?(time < timestamp(end_year, end_month, end_day, end_hour, end_minute)):true)

// Exit Condition
a = input(20)*10
b = input(40)*10
c = a*syminfo.mintick
d = b*syminfo.mintick

long_stop_level     = float(na)
long_profit_level1  = float(na)
long_profit_level2  = float(na)
long_even_level     = float(na)

short_stop_level    = float(na)
short_profit_level1 = float(na)
short_profit_level2 = float(na)
short_even_level    = float(na)

long_stop_level     := longCondition  ? close - c : long_stop_level     [1]
long_profit_level1  := longCondition  ? close + c : long_profit_level1  [1]
long_profit_level2  := longCondition  ? close + d : long_profit_level2  [1]
long_even_level     := longCondition  ? close + 0 : long_even_level     [1]

short_stop_level    := shortCondition ? close + c : short_stop_level    [1]
short_profit_level1 := shortCondition ? close - c : short_profit_level1 [1]
short_profit_level2 := shortCondition ? close - d : short_profit_level2 [1]
short_even_level    := shortCondition ? close + 0 : short_even_level    [1]

// Position Sizing
Risk = input(defval=10, title="Risk per trade%", step=1, minval=0, maxval=100)/100
size  = 1

// Strategy
if longCondition
    strategy.entry("Buy"  , strategy.long, qty=size)
    strategy.exit ("Exit1", stop=long_stop_level, limit=long_profit_level1, qty=size/2)
    strategy.exit ("Exit2", stop=long_stop_level, limit=long_profit_level2)

if shortCondition
    strategy.entry("Sell" , strategy.short, qty=size)
    strategy.exit ("Exit3", stop=short_stop_level, limit=short_profit_level1, qty=size/2)
    strategy.exit ("Exit4", stop=short_stop_level, limit=short_profit_level2)

// Plot
plot(strategy.position_size <= 0 ? na : long_stop_level    , color=#dc143c, style=plot.style_linebr, linewidth=1)
plot(strategy.position_size <= 0 ? na : long_profit_level1 , color=#00ced1, style=plot.style_linebr, linewidth=1)
plot(strategy.position_size <= 0 ? na : long_profit_level2 , color=#00ced1, style=plot.style_linebr, linewidth=1)
plot(strategy.position_size <= 0 ? na : long_even_level    , color=#ffffff, style=plot.style_linebr, linewidth=1)
plot(strategy.position_size >= 0 ? na : short_stop_level   , color=#dc143c, style=plot.style_linebr, linewidth=1)
plot(strategy.position_size >= 0 ? na : short_profit_level1, color=#00ced1, style=plot.style_linebr, linewidth=1)
plot(strategy.position_size >= 0 ? na : short_profit_level2, color=#00ced1, style=plot.style_linebr, linewidth=1)
plot(strategy.position_size >= 0 ? na : short_even_level   , color=#ffffff, style=plot.style_linebr, linewidth=1)
plot(ema,color=#00ced1)
plot(wma,color=#dc143c)