Trend Following Strategy Based on Moving Average and Super Trend

Author: ChaoZhang, Date: 2023-11-14 16:23:42
Tags:

img

Overview

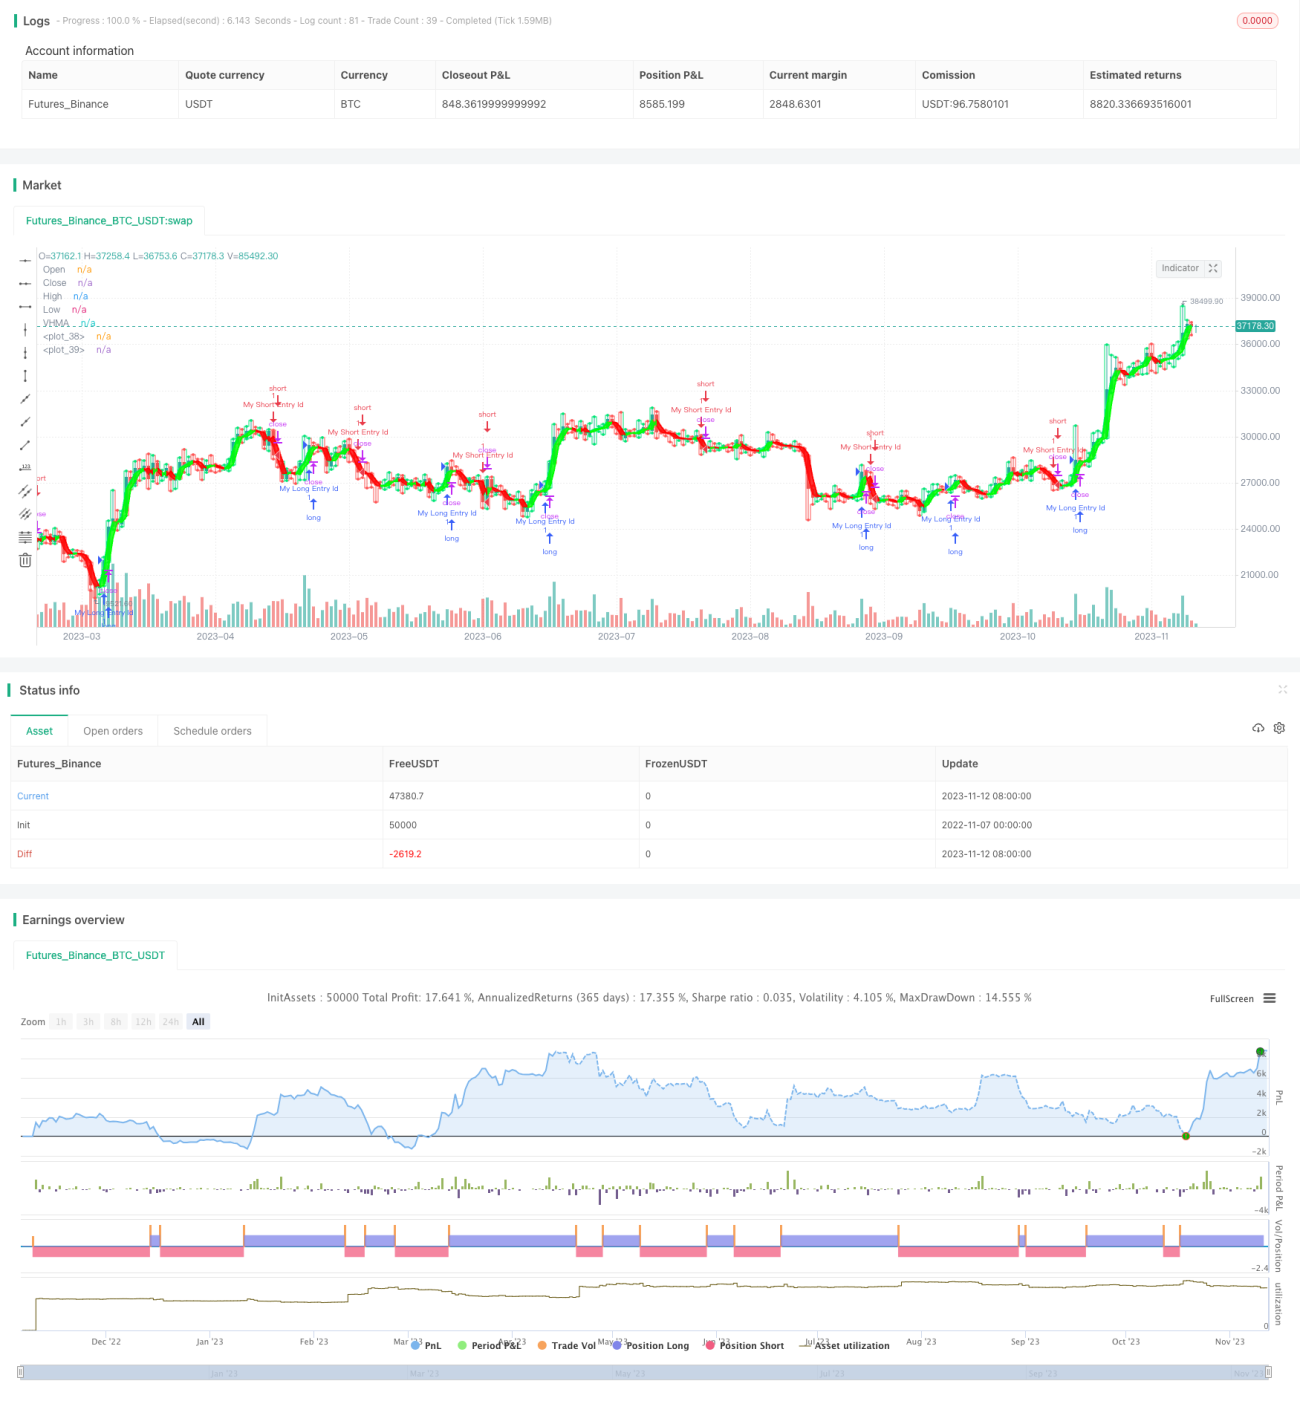
This strategy combines moving average and super trend indicators to follow the trend. It goes long when the trend is up and goes short when the trend is down.

Strategy Logic

  1. Calculate the weighted moving average MA. Use volume as weight to calculate the weighted average price over a period.

  2. Calculate the Hull moving average based on MA. Hull moving average is more sensitive to price changes.

  3. Calculate the super trend indicator. Super trend combines ATR to identify trend changes. It calculates the upper and lower bands.

  4. When close breaks above the upper band, go long. When close breaks below the lower band, go short.

  5. Plot auxiliary indicators like open, close, high and low to visually observe price movements.

  6. Make trading decisions based on indicator crossovers.

Advantage Analysis

  1. The strategy combines both moving average and super trend, enabling more accurate trend detection.

  2. Hull moving average is more sensitive to price changes, helping timely spot trend reversal.

  3. Super trend dynamically adjusts the upper and lower bands to adapt to market volatility.

  4. Auxiliary indicators visually display price movements to assist decision making with indicator signals.

  5. The strategy allows parameter optimization on moving average period, super trend multiplier etc.

Risk Analysis

  1. Whipsaws may generate false signals during range-bound markets, causing unnecessary trades.

  2. Monitoring multiple indicators can make the strategy relatively complex to implement.

  3. Parameters need proper adjustment to suit the characteristics of different products.

  4. Strict stop loss is required to limit losses on single positions.

  5. High trade frequency calls for impact control from commissions.

Optimization Directions

  1. Test different moving averages to find one more sensitive to the market.

  2. Test different super trend multipliers to catch trend changes in time.

  3. Incorporate volatility index to reduce position size when volatility rises.

  4. Add breakout conditions to avoid false signals during range-bound periods.

  5. Optimize stop loss strategy to make it more adaptive to market conditions.

Summary

This strategy judges trend direction using both moving average and super trend to follow the trend. The advantage is mutual verification between indicators for more accurate trend detection. But false signals should be watched out for. The strategy can be further improved through parameter optimization and risk control. It suits trend following operations on instruments with strong trending characteristics.


/*backtest
start: 2022-11-07 00:00:00
end: 2023-11-13 00:00:00
period: 1d
basePeriod: 1h
exchanges: [{"eid":"Futures_Binance","currency":"BTC_USDT"}]
*/

// This source code is subject to the terms of the Mozilla Public License 2.0 at https://mozilla.org/MPL/2.0/
// © rajukpatel

//@version=5
strategy('My RK Strategy with Alert', shorttitle='My RK Strategy with Alert', overlay=true )
src5 = input(close)

tf = input(1440)
len5 = timeframe.isintraday and timeframe.multiplier >= 1 ? tf / timeframe.multiplier * 7 : timeframe.isintraday and timeframe.multiplier < 60 ? 60 / timeframe.multiplier * 24 * 7 : 7

ma = ta.ema(src5 * volume, len5) / ta.ema(volume, len5)


//script taken from https://www.tradingview.com/script/kChCRRZI-Hull-Moving-Average/

src1 = ma

p(src1, len5) =>
    n = 0.0
    s = 0.0
    for i = 0 to len5 - 1 by 1
        w = (len5 - i) * len5
        n += w
        s += src5[i] * w
        s
    s / n

hm = 2.0 * p(src1, math.floor(len5 / 3)) - p(src1, len5)
vhma = p(hm, math.floor(math.sqrt(len5)))
lineColor = vhma > vhma[1] ? color.lime : color.red
plot(vhma, title='VHMA', color=lineColor, linewidth=3)
hColor = true
vis = true
hu = hColor ? vhma > vhma[2] ? #00ff00 : #ff0000 : #ff9800

vl = vhma[0]
ll = vhma[1]
m1 = plot(vl, color=hu, linewidth=1, transp=60)
m2 = plot(vis ? ll : na, color=hu, linewidth=2, transp=80)

fill(m1, m2, color=hu, transp=70)
//

b = timeframe.isintraday and timeframe.multiplier >= 1 ? 60 / timeframe.multiplier * 7 : timeframe.isintraday and timeframe.multiplier < 60 ? 60 / timeframe.multiplier * 24 * 7 : 7


//
res5 = input.timeframe('D')

o = request.security(syminfo.tickerid, res5, open, barmerge.gaps_off, barmerge.lookahead_on)
c = request.security(syminfo.tickerid, res5, close, barmerge.gaps_off, barmerge.lookahead_on)
hz = request.security(syminfo.tickerid, res5, high, barmerge.gaps_off, barmerge.lookahead_on)
l = request.security(syminfo.tickerid, res5, low, barmerge.gaps_off, barmerge.lookahead_on)


col = c >= o ? color.lime : color.red

ppo = plot(b ? o >= c ? hz : l : o, color=col, title='Open', style=plot.style_stepline, transp=100)
ppc = plot(b ? o <= c ? hz : l : c, color=col, title='Close', style=plot.style_stepline, transp=100)

plot(b and hz > c ? hz : na, color=col, title='High', style=plot.style_circles, linewidth=2, transp=60)
plot(b and l < c ? l : na, color=col, title='Low', style=plot.style_circles, linewidth=2, transp=60)

fill(ppo, ppc, col, transp=90)

//
// INPUTS //
st_mult = input.float(1, title='SuperTrend Multiplier', minval=0, maxval=100, step=0.01)
st_period = input.int(50, title='SuperTrend Period', minval=1)

// CALCULATIONS //
up_lev = l - st_mult * ta.atr(st_period)
dn_lev = hz + st_mult * ta.atr(st_period)

up_trend = 0.0
up_trend := c[1] > up_trend[1] ? math.max(up_lev, up_trend[1]) : up_lev

down_trend = 0.0
down_trend := c[1] < down_trend[1] ? math.min(dn_lev, down_trend[1]) : dn_lev

// Calculate trend var
trend = 0
trend := c > down_trend[1] ? 1 : c < up_trend[1] ? -1 : nz(trend[1], 1)

// Calculate SuperTrend Line
st_line = trend == 1 ? up_trend : down_trend

// Plotting
//plot(st_line[1], color = trend == 1 ? color.green : color.red , style = plot.style_cross, linewidth = 2, title = "SuperTrend")
buy = ta.crossover(c, st_line)
sell = ta.crossunder(c, st_line)
signal = input(false)

/////////////// Plotting /////////////// 
plotshape(signal and buy, style=shape.triangleup, size=size.normal, location=location.belowbar, color=color.new(color.lime, 0))
plotshape(signal and sell, style=shape.triangledown, size=size.normal, location=location.abovebar, color=color.new(color.red, 0))


if buy
    strategy.entry('My Long Entry Id', strategy.long)

if sell
    strategy.entry('My Short Entry Id', strategy.short)


More