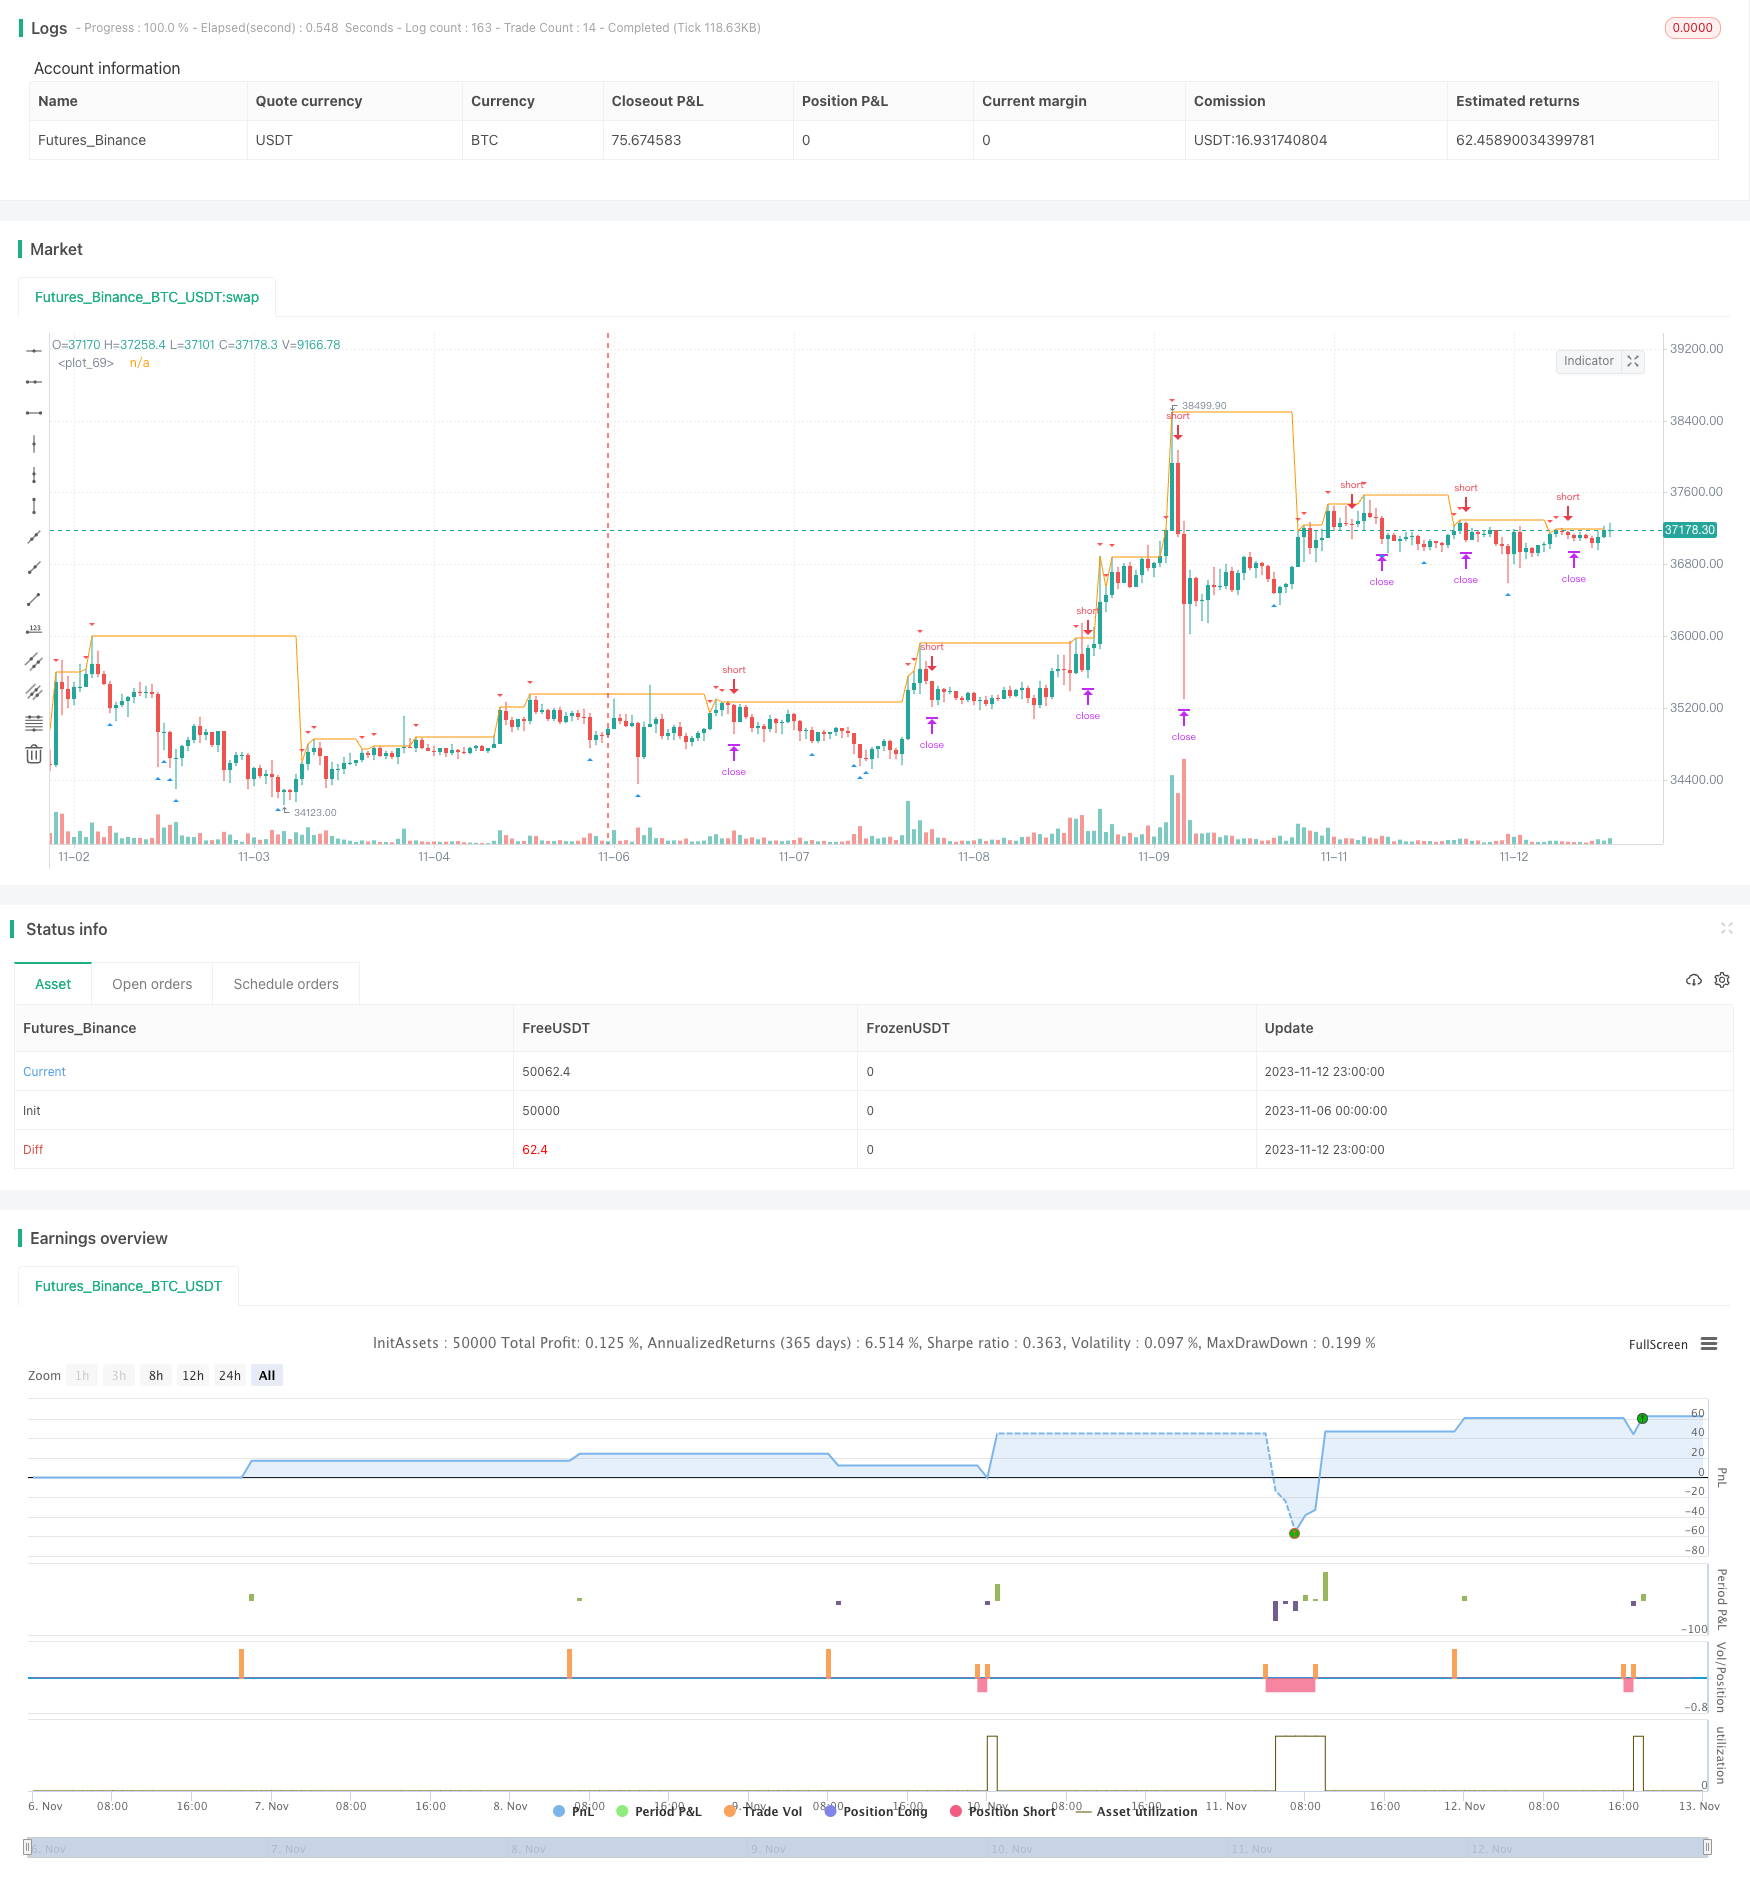
概述
RSI反转策略是一种利用相对强弱指标RSI识别超买超卖情况,在反转点进行买入卖出的量化交易策略。该策略通过设定RSI超买区和超卖区的阈值,在RSI进入超买区时做空,在RSI进入超卖区时做多,以捕捉价格反转获得利润。
策略原理
该策略主要基于以下原理:
RSI可以反映市场目前是否处于超买或超卖状态。RSI通过计算一段时间内的平均涨幅与平均跌幅之比,测量多头势头与空头势头的相对强度,来判断目前市场的超买超卖程度。
当RSI进入超买区(一般认为RSI大于70时为超买)时,说明多头势头已经很强,这时持有看涨仓位的交易者数量会比较多,继续看涨的空间有限,价格可能持续下跌以反转超买状态。
当RSI进入超卖区(一般认为RSI小于30时为超卖)时,说明空头势头已经很强,这时持有看跌仓位的交易者数量会比较多,继续看跌的空间有限,价格可能持续上涨以反转超卖状态。
因此,可以设定RSI超买区阈值为90,超卖区阈值为10,在RSI进入超买区时做空,在RSI进入超卖区时做多,以捕捉反转。
具体来看,该策略的核心逻辑是:
计算RSI指标值,以close收盘价作为RSI的计算输入源,长度为2周期。
当RSI上穿90时,表明进入超买区,做空开仓;当RSI下穿10时,表明进入超卖区,做多开仓。
对每一个开仓 trades,设置止损停损点。多头止损为最低价low,空头止损为最高价high。
对每一个开仓trades,设置追踪止损点。若RSI继续进入更加超卖区域,则调整追踪止损点,使止损距离更加宽松。
当反转来临,RSI重新进入50附近的中性区时,可以选择止盈平仓。
如果反转没有来临,开仓超过3根K线没有达到止损或止盈条件,则强制平仓,避免过度持仓带来的更大损失。
策略优势
该RSI反转策略具有以下几点优势:
采用RSI指标判断超买超卖情况,可以有效捕捉市场的反转点位。RSI对超买超卖情况判断准确,反转成功率较高。
反转交易策略具有继续跟风交易的系统性优势。当出现超买情况,可以及时做空,超卖则做多,避免被套。
策略加入止损机制可以有效控制单次交易的损失。即使反转没有成功,止损可以使损失控制在一定范围。
追踪止损可以根据价格继续运行的情况灵活调整止损距离,既保证止损起作用,也争取追踪更多价差。
强制止损确保过长时间不反转的交易可以平仓,不会带来无限期的亏损。
RSI的参数可调,可以针对不同市场调整参数,提高策略的适应性。
策略风险
该策略也存在一些风险需要注意:
RSI反转作为技术指标交易策略,其回测结果可能存在曲线拟合的风险。实盘中反转成功率可能低于回测结果。
RSI虽可以判断超买超卖,但无法预测反转的准确时间点。存在采用该策略后反转不出现,价格继续运行的风险。
策略确定的RSI超买超卖区域可能不合理,如果设定错误,可能导致错过反转或反转前夜盘破。
反转没达到止盈位就反向再次反转的概率存在,这时止盈可能无法成交。
停损点设定不合理,距离过近可能会被止损出局,距离过远又失去止损意义。
交易手续费可能也会对盈利造成一定影响。
策略优化
该RSI反转策略还可从以下几个方面进行优化:
测试不同的RSI参数,寻找最优参数组合,如测试RSI长度、超买区阈值、超卖区阈值等。
加入更多过滤条件,避免虚假反转的噪声,如结合MACD指标等确定反转高概率区。
优化止损策略,如根据ATR止损,按波动率设置止损距离等。
优化止盈策略,设置移动止盈,追踪更大价差等。
加入机器学习模型辅助判断,提高反转成功率。
测试不同市场及品种的数据,调整参数获得最佳实盘效果。
结合交易量,只在交易量放大的情况下考虑反转信号。
总结
整体来说,RSI反转策略利用RSI指标识别超买超卖市场状态的优点,在反转点进行交易,可以获得不错的系统性收益。但该策略也存在一定的风险,需要对RSI参数及止损止盈策略进行优化测试,辅以其他过滤指标减少误交易。如果方法得当,RSI反转策略可以成为量化交易体系中的一个有效策略模块。
/*backtest
start: 2023-11-06 00:00:00
end: 2023-11-13 00:00:00
period: 1h
basePeriod: 15m
exchanges: [{"eid":"Futures_Binance","currency":"BTC_USDT"}]
*/

//@version=4
// Copyright (c) 2021-present, RicMos
//study("RSI2 Sell Strategy, overlay=true)

//------------------------------------------USER VARIABLE DEFINITIONS --------------------------------------
var float lots = 0.1
//var float fixed_commission = 0.6 // forex pairs commission  value USD per position size two sides
var float fixed_commission = 10 // BTC commission value USD per position size two sides
//var float money = 10000 //forex pairs position size
var float money = 0.3333 //BTC position size


strategy(title="RSI2 Sell Strategy", commission_type=strategy.commission.cash_per_order, calc_on_every_tick =true, commission_value = fixed_commission/2, overlay=true, default_qty_value= lots*100000, initial_capital=1000, currency = "USD", calc_on_order_fills = false)
len = input(2, minval=1, title="RSI Length")
src = input(close, "RSI Source", type = input.source)
upRsi = rma(max(change(src), 0), len)
downRsi = rma(-min(change(src), 0), len)
rsi = downRsi == 0 ? 100 : upRsi == 0 ? 0 : 100 - (100 / (1 + upRsi / downRsi))
var color buyColor = color.blue
var color sellColor = color.red


plotshape(rsi <= 10 ? low : na, title="Arrow Up", style=shape.triangleup, location=location.belowbar, size=size.tiny, color=buyColor)
plotshape(rsi >= 90 ? high : na, title="Arrow Down", style=shape.triangledown, location=location.abovebar, size=size.tiny, color=sellColor)


// long = rsi <= 10
// var float longsl = 0
// var int long_ts_points = 0

// if long
//     longsl:= low
//     long_ts_points := 200

// if rsi >= 70
//     long_ts_points := 100
// else if rsi >= 80
//     long_ts_points := 80


// plot (longsl)
// var int barsPassed = 0
// barsPassed := barssince(long)
// if long
//     strategy.entry("long", long = strategy.long, qty = 10000, stop = high)
// strategy.exit("slLo", from_entry="long", stop = longsl-0.0002, trail_points = long_ts_points )
// //strategy.close("long", when = rsi[1]>=50 and rsi < 50 , comment = "rsi under 50" )
// strategy.cancel_all(barsPassed > 3  and not long)


short = rsi >= 90
var float shortsl = 0
var int short_ts_points = 0
//var bool stClose = 0

if short
    shortsl:= high
    short_ts_points := 200

if rsi <= 30
    short_ts_points := 100
    //stClose :=1
else if rsi <= 20
    short_ts_points := 80
//else
    //stClose := 0

plot (shortsl)
var int barsPassedSh = 0
barsPassedSh := barssince(short)
if short
    strategy.entry("short", long = strategy.short, qty = money, stop = low)
strategy.exit("slSh", from_entry="short", stop = shortsl, trail_points = short_ts_points, trail_offset =20 )
//strategy.close("short", comment="rsi<30", when = stClose)


//strategy.close("long", when = rsi[1]>=50 and rsi < 50 , comment = "rsi under 50" )
strategy.cancel_all(barsPassedSh > 3  and not short)