Dual Moving Average Trend Following Strategy

Overview
The dual moving average trend following strategy calculates the double exponential moving averages of the price to form fast and slow lines. It identifies price trends based on the crossover of the two lines to implement trend following trading. This strategy belongs to quantitative trading strategies based on trend following.
Strategy Logic
The strategy first calculates the double exponential moving averages of the price, including fast and slow lines. The fast line has a period of 4, and the slow line has a period of 8. Trading signals are generated when the two lines cross. When the fast line crosses above the slow line, a buy signal is generated. When the fast line crosses below the slow line, a sell signal is triggered. In addition, the strategy also calculates the MACD indicator to provide additional trading signals. Diverging red MACD bars are sell signals, while converging green bars are buy signals. By combining the crossover of dual moving averages and MACD indicator, the strategy identifies price trend directions for trend following trading.
Advantage Analysis
Firstly, this strategy trades along the price trend to avoid transaction costs. Secondly, the dual moving averages filter out some price noises and capture the price trend smoothly. Also, the flexible parameter optimization of the moving averages and MACD makes the strategy adaptable to different products and environments. Finally, the simple and clear logic makes this strategy easy to understand and implement, suitable for quantitative trading algorithm design.
Risk Analysis
The strategy relies heavily on parameter optimization. Improper parameter settings may generate many false signals. Additionally, the lagging nature of dual moving averages may cause missed turning points. Trend following strategies are also prone to chasing uptrends and killing downtrends, which poses certain risks. Moreover, the liquidity of the trading products and transaction costs will also affect the strategy's profitability. To mitigate risks, parameters can be optimized, additional filters can be added, and position sizing can be controlled.
Improvement Directions
The following aspects of the strategy can be improved:
-
Optimize the periods of the dual moving averages to find the optimal combination.
-
Add other indicators like RSI and KD to filter signals and improve quality.
-
Incorporate stop loss strategies to exit trades at trend reversals.
-
Dynamically adjust position sizing based on market conditions to control risk.
-
Optimize parameters for different trading products.
-
Incorporate advanced strategies like machine learning to improve performance.
Conclusion
In summary, this is a simple dual moving average trend following strategy. The strategy logic is straightforward and easy to implement. The flexible parameter tuning makes it suitable as an introductory quantitative trading strategy. However, the risks of chasing trends and signal lagging need to be addressed through further enhancements to improve stability and risk control. Overall, this strategy provides a great learning opportunity for beginners and establishes a foundation for advanced strategies.
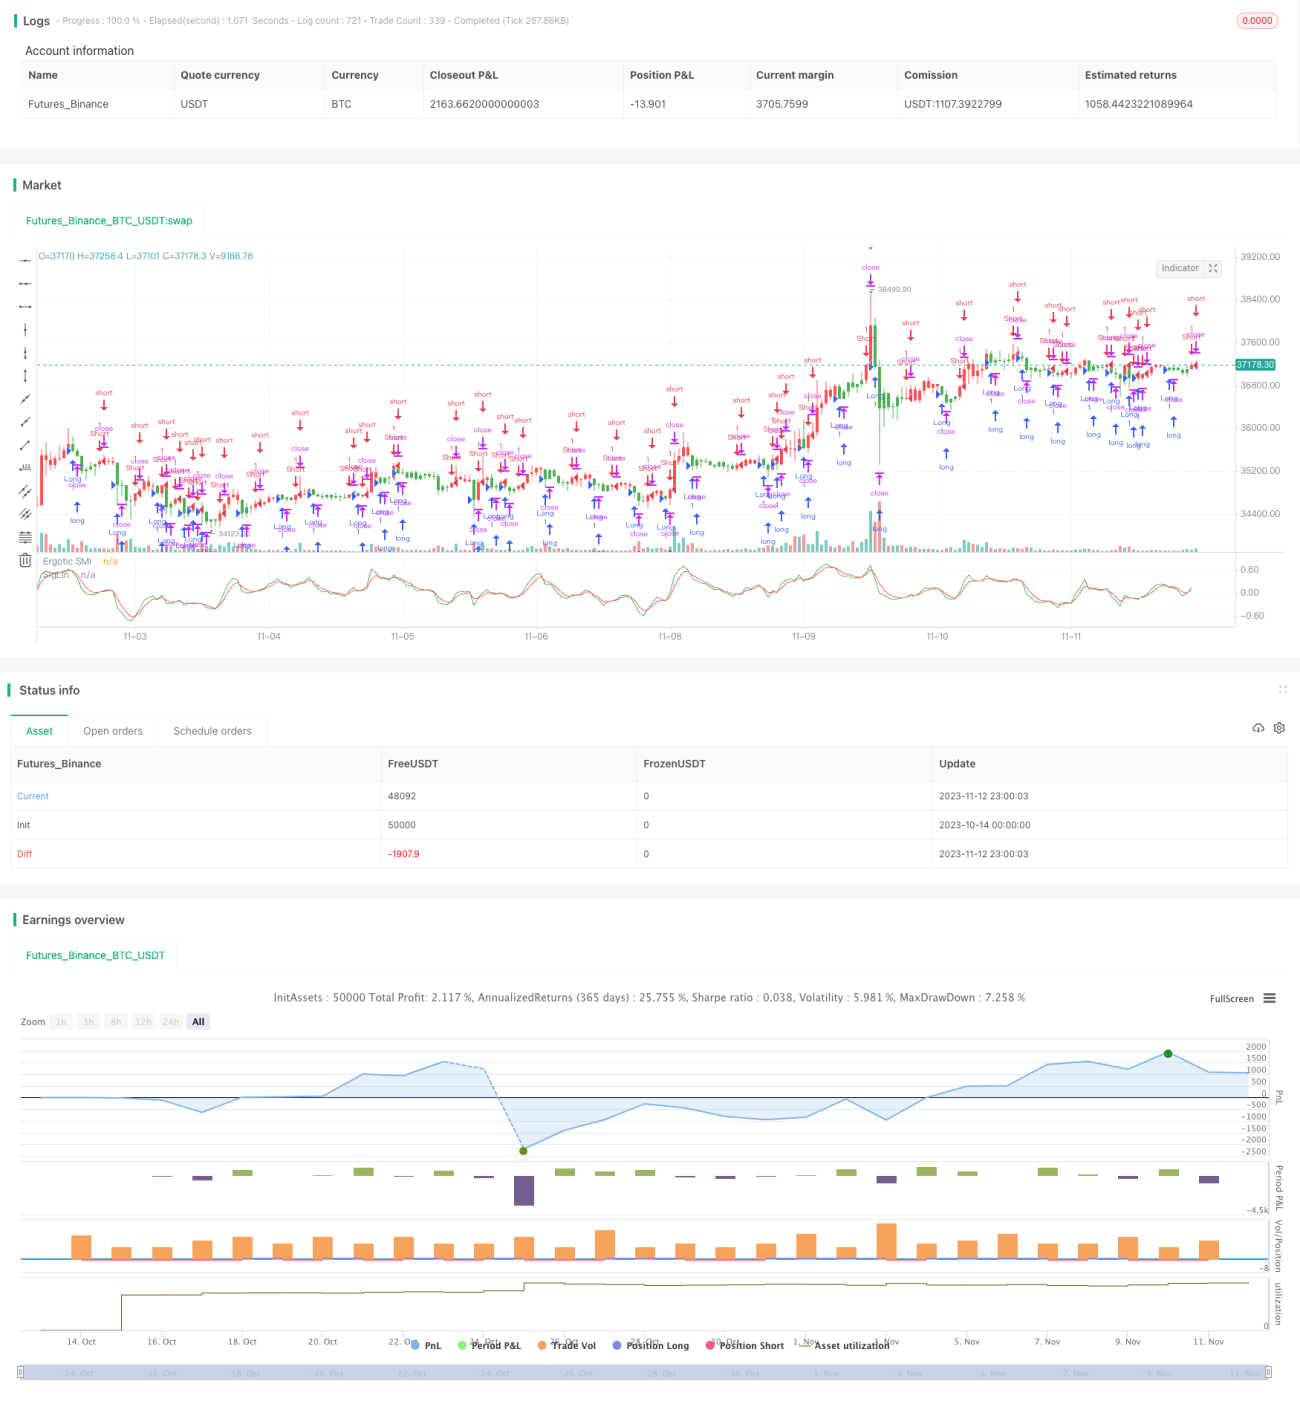
/*backtest
start: 2023-10-14 00:00:00
end: 2023-11-13 00:00:00
period: 1h
basePeriod: 15m
exchanges: [{"eid":"Futures_Binance","currency":"BTC_USDT"}]
*/

//@version=2
////////////////////////////////////////////////////////////
//  Copyright by HPotter v1.0 12/11/2017
// The SMI Ergodic Indicator is the same as the True Strength Index (TSI) developed by - 1