Momentum Breakout Strategy

Author: ChaoZhang, Date: 2023-11-15 11:09:21
Tags:

img

Overview

The Momentum Breakout strategy is a quantitative trading strategy that follows market trends. It calculates the momentum indicator based on historical prices to determine the trend and strength of market price movements, aiming to capture mid-to-long term trends in the market. It goes long when the momentum crosses from negative to positive, and goes short when the momentum crosses from positive to negative. This strategy is suitable for markets with obvious trends and can achieve excess returns.

Strategy Logic

The core of this strategy is based on the momentum indicator. The momentum indicator is the current period’s closing price minus the closing price N periods ago. When the latest bar’s close is higher than N periods ago, the momentum is positive, indicating an upward trend; when the latest bar’s close is lower than N periods ago, the momentum is negative, indicating a downward trend.

The strategy first calculates the 18-period momentum, which is the current close minus the close 18 periods ago, stored in mom0. It then calculates the 1-period momentum of mom0, stored in mom1.

When mom0>0 and mom1>0, a long signal is generated, indicating strong upside momentum. When mom0<0 and mom1<0, a short signal is generated, indicating strong downside momentum.

The strategy records the time of the most recent long and short signals. When the long signal time is more recent than the short signal time, it holds a long position. When the short signal time is more recent than the long signal time, it holds a short position.

Advantage Analysis

The advantages of this strategy include:

  1. The logic is simple and easy to understand, suitable for beginners in quantitative trading.

  2. Momentum indicators can capture market trends and strength with relatively high winning rates when tracking mid-to-long term trends.

  3. The dual momentum filter helps avoid losses from false breakouts.

  4. It adds positions after signal to establish trend positions and achieve excess returns during trending markets.

  5. Timely stop loss exit controls single trade loss size and avoids large losses from reversals.

Risk Analysis

Some risks of this strategy to note:

  1. Stop loss exit during short-term pullbacks in an uptrend, unable to capture the entire trend. Can consider widening the stop loss range.

  2. Frequent open and close trades in ranging markets increases costs from commissions and slippage. Can consider loosening filters to reduce trade frequency.

  3. Continued holdings in original direction after trend reversal enlarges losses. Can incorporate trend indicators to detect reversals.

  4. Improper parameter settings lead to missing signals or generating false signals. Parameters need to be adjusted for different markets.

Optimization Directions

Some ways to optimize the strategy:

  1. Optimize momentum parameters by adjusting the momentum length calculation based on timeframe and market. Improve signal quality.

  2. Add other indicator filters like MACD, KD to avoid losses from trend reversals.

  3. Optimize stop loss strategy by widening stops in trends and tightening stops in non-trending markets.

  4. Add position sizing rules to decrease size in non-trends and increase size in trends to capture more profits.

  5. Optimize parameters separately for different products to improve adaptiveness.

  6. Incorporate machine learning algorithms to dynamically optimize parameters.

Conclusion

The Momentum Breakout strategy is an intuitive trend following system. It can effectively capture mid-to-long term trends and achieve good profits during trending markets. Risk management through stop loss optimization and using other indicators to judge trend are also important. With continuous optimization, this strategy can be developed into a stable profit-generating quantitative trading system.
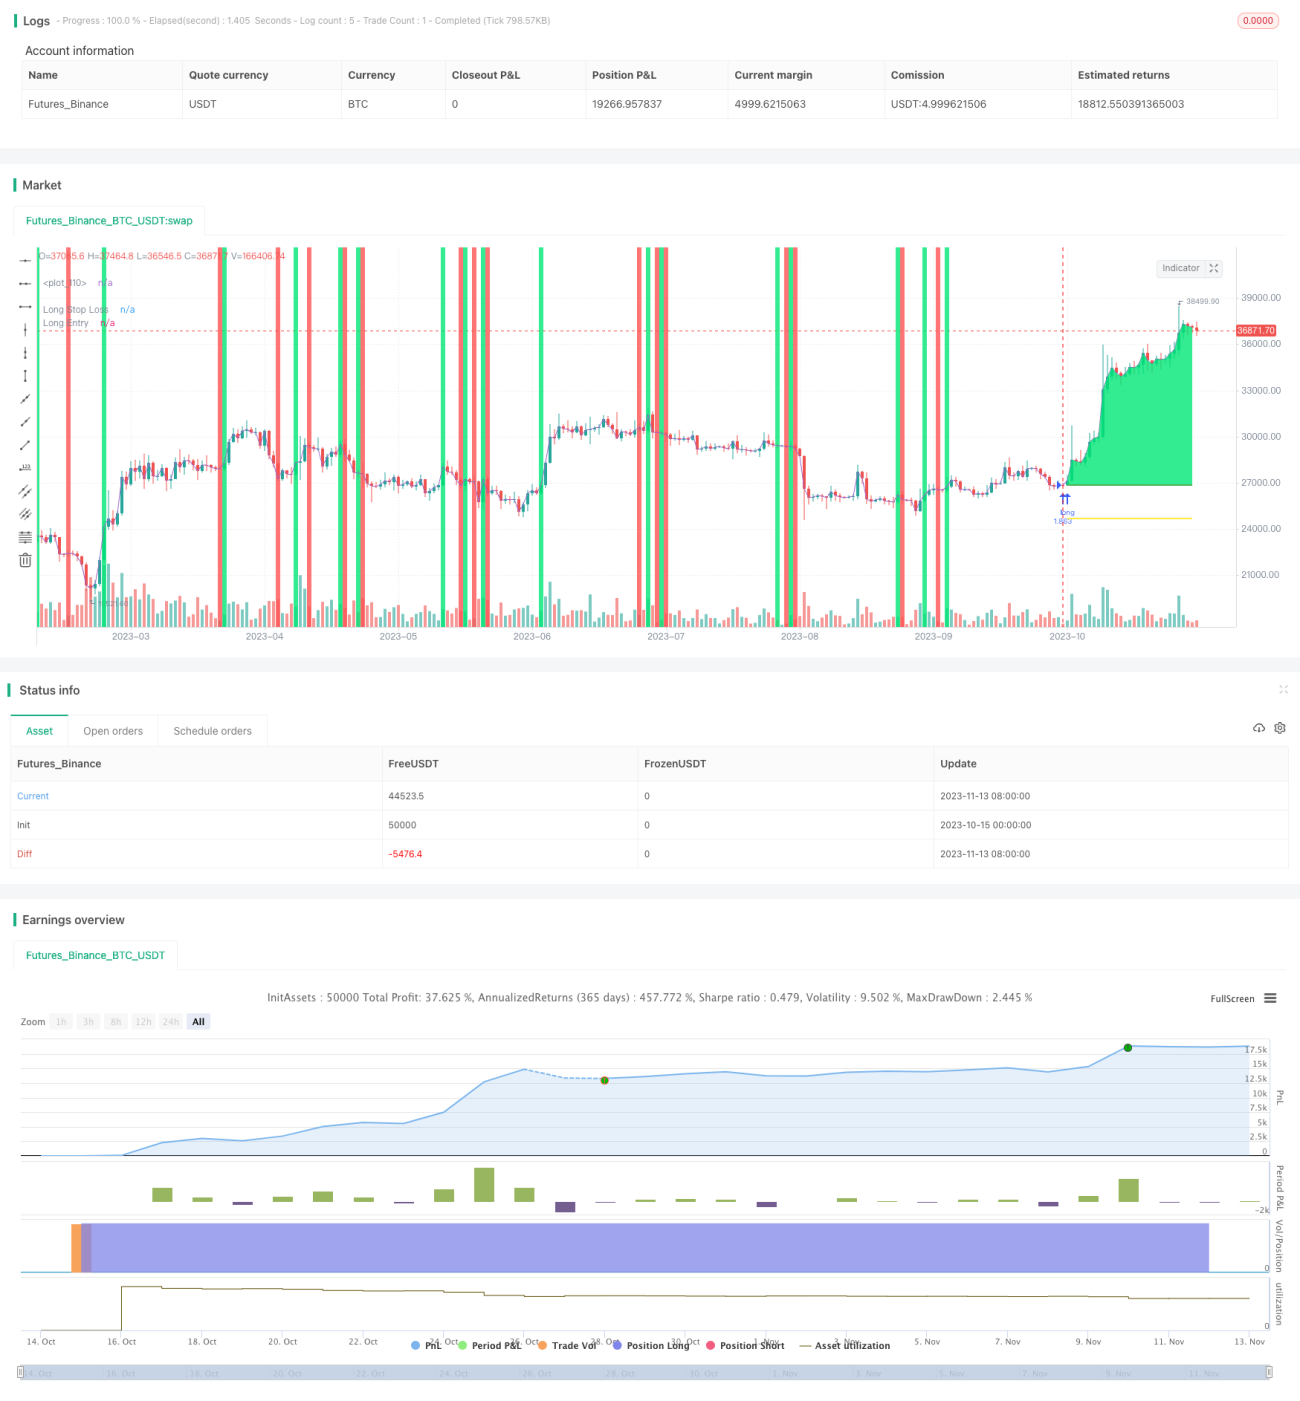

/*backtest
start: 2023-10-15 00:00:00
end: 2023-11-14 00:00:00
period: 1d
basePeriod: 1h
exchanges: [{"eid":"Futures_Binance","currency":"BTC_USDT"}]
*/

//@version=4
strategy("Momentum BF πŸš€", overlay=true, precision=2, initial_capital=10000, default_qty_type=strategy.percent_of_equity, default_qty_value=100, commission_type=strategy.commission.percent, commission_value=0.075)

/////////////// Time Frame ///////////////
_0 = input(false,  "════════ Test Period ═══════")
testStartYear = input(2017, "Backtest Start Year") 
testStartMonth = input(1, "Backtest Start Month")
testStartDay = input(1, "Backtest Start Day")
testPeriodStart = timestamp(testStartYear,testStartMonth,testStartDay, 0, 0)

testStopYear = input(2019, "Backtest Stop Year")
testStopMonth = input(12, "Backtest Stop Month")
testStopDay = input(31, "Backtest Stop Day")
testPeriodStop = timestamp(testStopYear,testStopMonth,testStopDay, 0, 0)

testPeriod() => true

///////////// Momentum /////////////
_1 = input(false, "═══════ Momentum ══════")
length = input(18)
price = close

momentum(seria, length) =>
    mom = seria - seria[length]
    mom

mom0 = momentum(price, length)
mom1 = momentum(mom0, 1)

/////////////// Strategy /////////////// 
long = mom0 > 0 and mom1 > 0
short = mom0 < 0 and mom1 < 0

last_long = 0.0
last_short = 0.0
last_long := long ? time : nz(last_long[1])
last_short := short ? time : nz(last_short[1])

long_signal = crossover(last_long, last_short)
short_signal = crossover(last_short, last_long)

last_open_long_signal = 0.0
last_open_short_signal = 0.0
last_open_long_signal := long_signal ? open : nz(last_open_long_signal[1])
last_open_short_signal := short_signal ? open : nz(last_open_short_signal[1])

last_long_signal = 0.0
last_short_signal = 0.0
last_long_signal := long_signal ? time : nz(last_long_signal[1])
last_short_signal := short_signal ? time : nz(last_short_signal[1])

in_long_signal = last_long_signal > last_short_signal
in_short_signal = last_short_signal > last_long_signal

last_high = 0.0
last_low = 0.0
last_high := not in_long_signal ? na : in_long_signal and (na(last_high[1]) or high > nz(last_high[1])) ? high : nz(last_high[1])
last_low := not in_short_signal ? na : in_short_signal and (na(last_low[1]) or low < nz(last_low[1])) ? low : nz(last_low[1])

since_longEntry = barssince(last_open_long_signal != last_open_long_signal[1]) 
since_shortEntry = barssince(last_open_short_signal != last_open_short_signal[1]) 

/////////////// Stop Losses Long ///////////////
_5 = input(false,  "═══════ Stop Loss L ══════")
SL_typel = input("Fixed", options=["Fixed", "ATR Derived"], title="Stop Loss Type")
sl_inpl = input(8.0, title='Fixed Stop Loss %') / 100
atrLkbl = input(20, minval=1, title='ATR Stop Period')
atrMultl = input(1.5, step=0.25, title='ATR Stop Multiplier') 
atr1l = atr(atrLkbl)

longStop1l = 0.0
longStop1l := short_signal ? na : long_signal ? close - (atr1l * atrMultl) : longStop1l[1]

slLongl = in_long_signal ? strategy.position_avg_price * (1 - sl_inpl) : na
long_sll = in_long_signal ? slLongl : na

/////////////// Stop Losses Short ///////////////
_6 = input(false, "═══════ Stop Loss S ══════")
SL_types = input("Fixed", options=["Fixed", "ATR Derived"], title="Stop Loss Type")
sl_inps = input(7.0, title='Fixed Stop Loss %') / 100
atrLkbs = input(20, minval=1, title='ATR Stop Period')
atrMults = input(1.5, step=0.25, title='ATR Stop Multiplier') 
atr1s = atr(atrLkbs)

shortStop1s = 0.0
shortStop1s := long_signal ? na : short_signal ? close + (atr1s * atrMults) : shortStop1s[1]

slShorts = strategy.position_avg_price * (1 + sl_inps)
short_sls = in_short_signal ? slShorts : na

_7 = input(false, "══════ Longs or Shorts ═════")
useLongs = input(true, title="Use Longs")
useShorts = input(true, title="Use Shorts")

/////////////// Execution ///////////////
if testPeriod()
    if useLongs
        strategy.entry("L", strategy.long, when=long)
        strategy.exit("L SL", "L", stop = SL_typel == "Fixed" ? long_sll : longStop1l, when=since_longEntry > 0)
    if useShorts
        strategy.exit("S SL", "S", stop = SL_types == "Fixed" ? short_sls : shortStop1s, when=since_shortEntry > 0)
        strategy.entry("S", strategy.short, when=short)
    if not useShorts
        strategy.close("L", when=short)
    if not useLongs
        strategy.close("S", when=long)

/////////////// Plotting /////////////// 
bgcolor(long_signal ? color.lime : short_signal ? color.red : na, transp=40)
p0 = plot(close)
p1 = plot(strategy.position_size <= 0 ? na : SL_typel == "Fixed" ? long_sll : longStop1l, title="Long Stop Loss", color=color.yellow, style=plot.style_linebr, linewidth=2)
p2 = plot(strategy.position_size >= 0 ? na : SL_types == "Fixed" ? short_sls : shortStop1s, title="Short Stop Loss", color=color.orange, style=plot.style_linebr, linewidth=2)
p3 = plot(strategy.position_size <= 0 ? na : strategy.position_avg_price, style=plot.style_linebr, title="Long Entry", color=color.green, linewidth=2)
p4 = plot(strategy.position_size >= 0 ? na : strategy.position_avg_price, style=plot.style_linebr, title="Short Entry", color=color.red, linewidth=2)
fill(p0, p3, color = color.lime, transp=60)
fill(p0, p4, color = color.red, transp=60)

More