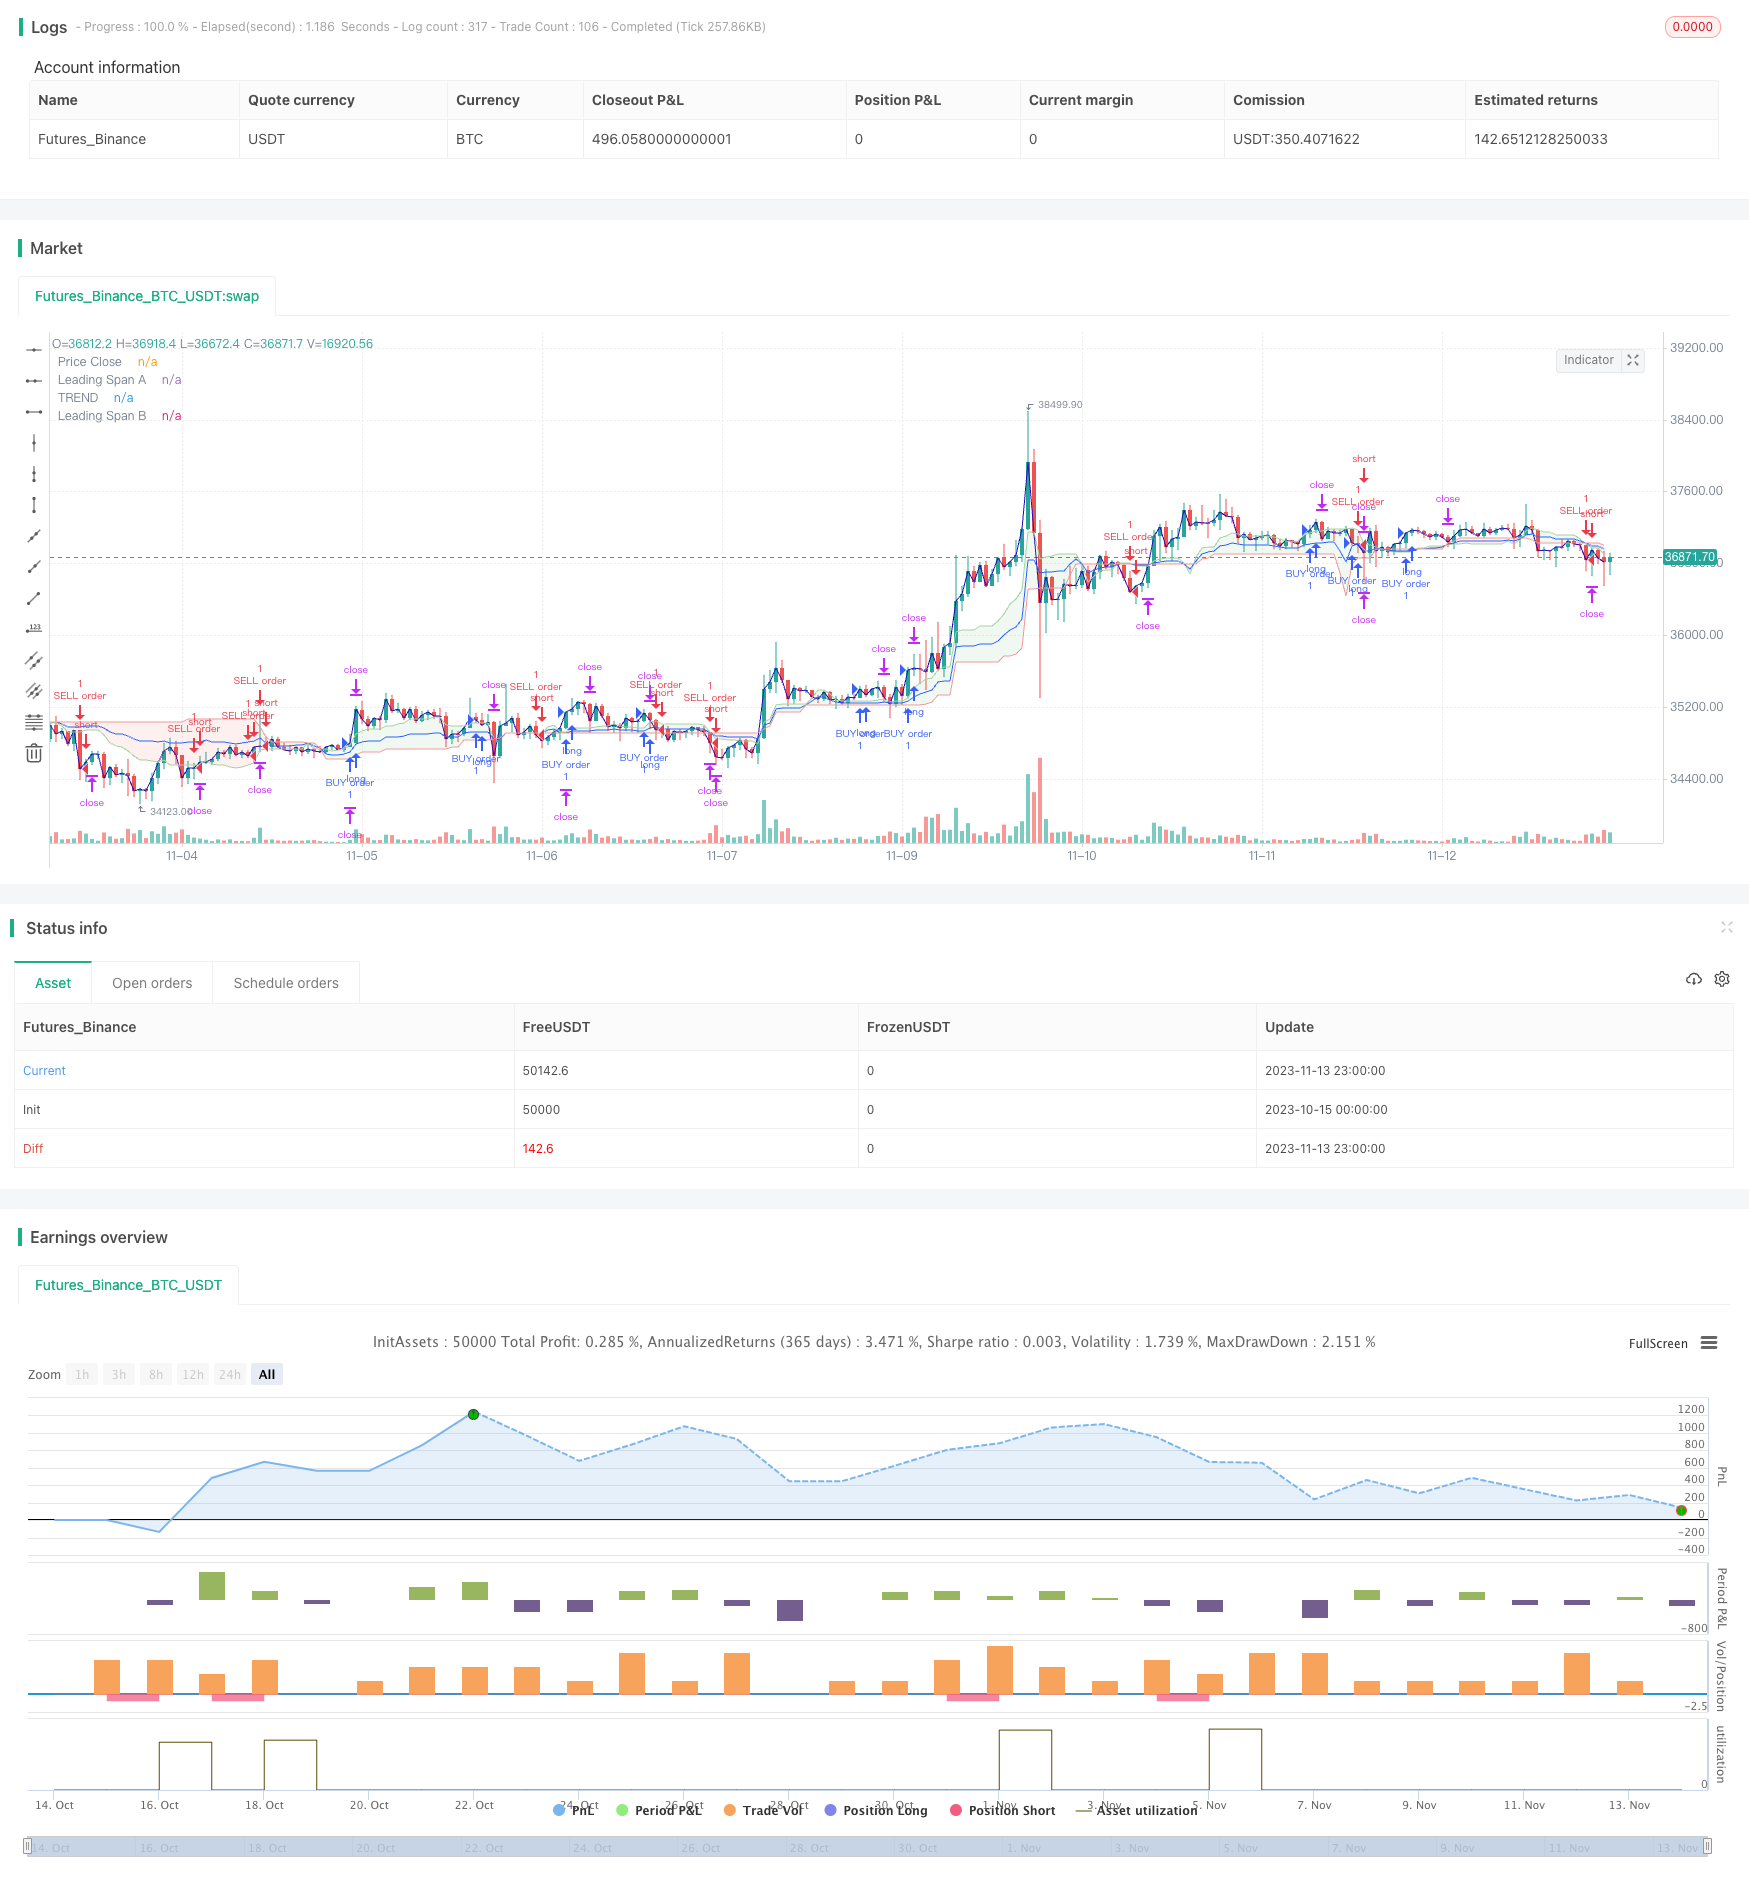
概述
本策略基于ICHIMOKU云图形态指标和STOCH随机指标,实现对趋势的判断和跟踪。策略名为“云图Stoch趋势跟踪策略”。
策略原理
该策略主要通过ICHIMOKU云图和STOCH指标判断当前趋势方向,以及过冲超买超卖情况。
当Conversion Line转换线上穿Base Line基准线而Stoch指标从超卖区域反弹时,认为处于看涨行情,该策略采取看涨方向;当Conversion Line下穿Base Line而Stoch指标从超买区域回落时,认为处于看跌行情,该策略采取看跌方向。
代码中,Conversion Line转换线定义为近N1个K线的最高价和最低价的平均值;Base Line基准线定义为近N2个K线的最高价和最低价的平均值。当转换线上穿基准线时产生看涨信号。
Stoch指标中,定义了超买线和超卖线阈值,以及平滑参数K和D。Stoch从超卖区域反弹时产生看涨信号,从超买区域回落时产生看跌信号。
综合两种指标,该策略实现对趋势方向的判断。
优势分析
该策略结合图形形态指标和超买超卖指标,能够有效判断趋势方向。
相较于单一使用趋势判断指标,该策略综合考虑了趋势和过冲情况,可以更准确判断入场时机。
ICHIMOKU云图能够识别中长线趋势,而Stoch指标可以发现短期超买超卖情况,二者互补形成系统性判断。
风险分析
该策略主要存在以下风险:
当出现突发黑天鹅事件时,指标失效的系统性风险。
存在一定的滞后性,可能错过部分行情或反向开仓的风险。
多因子的综合判断存在一定主观性,参数设置不当可能导致失误的风险。
交易频繁时,交易成本会对盈利产生一定影响。
对应优化措施:
结合新闻事件判断,避免主要政策事件出现时的盲目交易。
适当缩短周期参数,降低滞后判断的概率。
做回测优化参数,提高参数设置的科学性。
适当加大止盈止损幅度,降低交易频率。
优化方向
该策略主要可从以下方面进行优化:
优化ICHIMOKU转换线和基准线的周期参数,使之更符合不同市场的特点。
优化Stoch指标的K、D平滑参数,以及超买超卖阈值参数。
3.增加其他指标判断,形成多因子模型,提高策略系统性。
优化止盈止损点位,降低交易频率的同时保证盈利。
增加对突发事件的判断模块,避免在重大事件出现时失效。
总结
本策略基于ICHIMOKU云图和Stoch指标,实现对趋势方向和超买超卖情况的综合判断,能够有效跟踪趋势行情。由于考虑了图形形态和量化指标,使得策略更具系统性。未来可通过优化参数、增加其他指标以及突发事件判断模块等方式进一步优化该策略。
/*backtest
start: 2023-10-15 00:00:00
end: 2023-11-14 00:00:00
period: 1h
basePeriod: 15m
exchanges: [{"eid":"Futures_Binance","currency":"BTC_USDT"}]
*/

//@version=5
strategy("ICHI + STOCH V1", overlay=true)
length = input.int(20, minval=1)
smoothK = input(5)
smoothD = input(3)
OverBought = input(25)
OverSold = input(65)
Profit = input(1800)
Stop = input(1200)
k = ta.sma(ta.stoch(close, high, low, length), smoothK)
d = ta.sma(k, smoothD)
co = ta.crossover(k,d)
cu = ta.crossunder(k,d)
conversionPeriods = input.int(9, minval=1, title="Conversion Line Length")
basePeriods = input.int(26, minval=1, title="Base Line Length")
laggingSpan2Periods = input.int(52, minval=1, title="Leading Span B Length")
displacement = input.int(1, minval=1, title="Lagging Span")
conversionLine = math.avg(ta.lowest(conversionPeriods), ta.highest(conversionPeriods))
baseLine = math.avg(ta.lowest(basePeriods), ta.highest(basePeriods))
leadLine1 = math.avg(conversionLine, baseLine)
leadLine2 = math.avg(ta.lowest(laggingSpan2Periods), ta.highest(laggingSpan2Periods))
TREND = ta.ema(math.avg(leadLine1,leadLine2),displacement)
//plot(conversionLine, color=#2962FF, title="Conversion Line")
//plot(baseLine, color=#B71C1C, title="Base Line")
//plot(close, offset = -displacement + 1, color=#43A047, title="Lagging Span")
plot(TREND, color=#2962FF, title="TREND")
p1 = plot(leadLine1,style=plot.style_line, offset = displacement - 1, color=#A5D6A7,
	 title="Leading Span A")

p2 = plot(leadLine2,style=plot.style_line, offset = displacement - 1, color=#EF9A9A,
	 title="Leading Span B")
fill(p1, p2, color = leadLine1 > leadLine2 ? color.rgb(67, 160, 71, 90) : color.rgb(244, 67, 54, 90))
close_price = ta.sma(close,1)
pc = plot(close_price,style=plot.style_line, color=#2a0ab9,
	 title="Price Close")
if (not na(k) and not na(d))
	if (co and k < OverSold)and(close_price > TREND)
		strategy.entry("BUY order", strategy.long, comment="BUY order")
		strategy.exit("exitBUY", "BUY order", profit = Profit, loss = Stop)
	if (cu and k > OverBought)and(close_price < TREND)
		strategy.entry("SELL order", strategy.short, comment="SELL order")
		strategy.exit("exitSELL", "SELL order", profit = Profit, loss = Stop)
//plot(strategy.equity, title="equity", color=color.red, linewidth=2, style=plot.style_areabr)