Dual Moving Average Stop Loss Strategy

Author: ChaoZhang, Date: 2023-11-15 15:44:48
Tags:

img

Overview

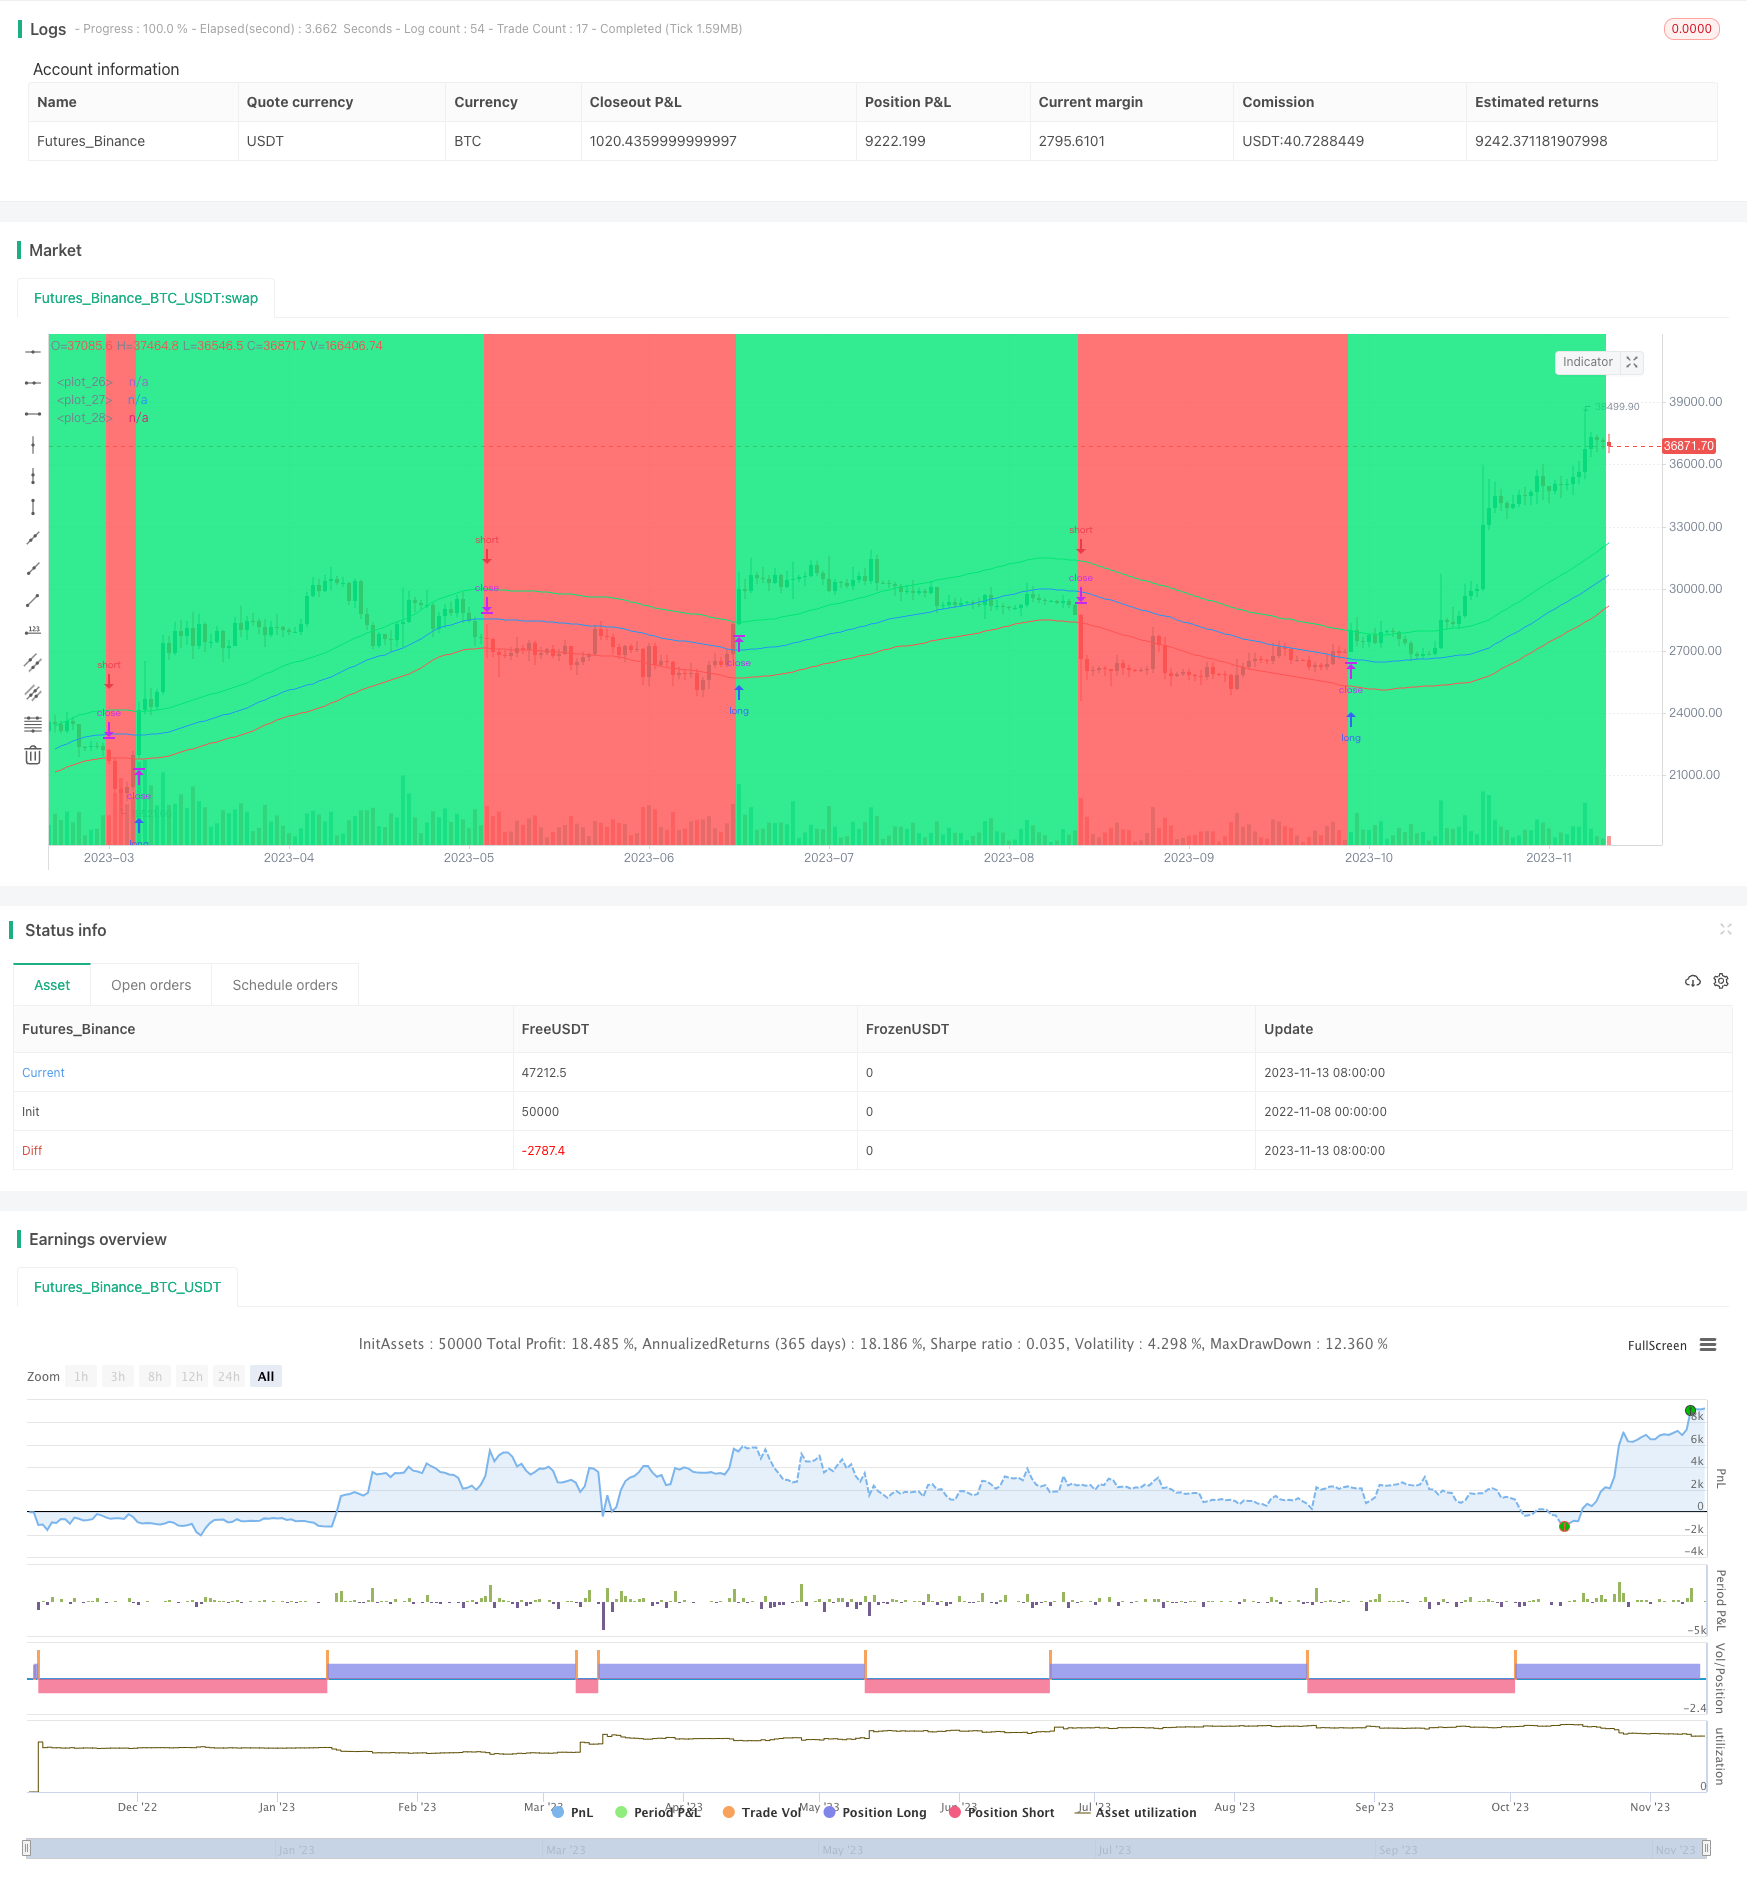
This strategy is a stop loss strategy based on dual moving averages. It uses two moving averages, one as the main moving average, and one as the stop loss line. When the price is above the main moving average, go long. When the price is below the stop loss line, close the long position. When the price is below the main moving average, go short. When the price is above the stop loss line, close the short position. It achieves stop loss and take profit by dynamically adjusting the long and short prices.

Strategy Logic

This strategy uses the sma function to calculate the simple moving average of length len as the main moving average line ma. Then according to the user input long stop loss percentage elpercent and short stop loss percentage espercent, it calculates the long stop loss line el and short stop loss line es. The specific formulas are:

el = ma + (ma * elpercent / 100) es = ma + (ma * espercent / 100)

Where elpercent and espercent represent the percentage offset from the main moving average line.

This gives us three lines: main moving average ma, long stop loss line el, and short stop loss line es.

The trading logic of the strategy is:

If the closing price is above the long stop loss line el, open a long position. If the closing price is below the short stop loss line es, close the long position.

If the closing price is below the short stop loss line es, open a short position. If the closing price is above the long stop loss line el, close the short position.

Advantages of the Strategy

  1. Using dual moving averages to set stop loss and take profit points can effectively control risks.

  2. The length of the main moving average len and the offset percentages elpercent and espercent are customizable, which can be adjusted for different markets and adapt well.

  3. The stop loss mechanism can cut losses in time and avoid further losses.

  4. The strategy logic is simple and clear, easy to understand and implement, suitable for beginners.

  5. It can go both long and short to take advantage of two-way markets.

Risks and Solutions

  1. Backtest overfitting risk. Moving average strategies tend to overfit backtest data. Actual performance may differ. Solution is to verify in complex live markets and adjust parameters accordingly.

  2. Risk of stop loss being too close. If the stop loss is too close to the main moving average, it may be triggered by short-term price fluctuations. Increase the stop loss distance to avoid this.

  3. Capital pressure from dual direction trading. Going both long and short requires sufficient margin. Reduce position size to control capital pressure.

  4. Parameter optimization risk. Optimal parameters vary greatly across different market conditions. Time is needed to optimize parameters. Can use machine learning to assist parameter optimization.

Optimization Directions

  1. Consider adding more indicators to determine market trend and improve decisions, e.g. volume price indicator, volatility indicator.

  2. Research auto-optimization of moving average length and stop loss parameters based on market changes.

  3. Add filtering on trading instruments, only trading obvious trends.

  4. Consider trailing stop loss instead of fixed stop loss, adjusting stops based on real-time prices.

  5. Build evaluation system for parameter optimization to automatically find optimum parameter sets via backtest results.

Conclusion

The overall logic of this strategy is clear and easy to understand. It uses dual moving averages for stop loss and can effectively control risks. The strategy has advantages like customizable parameters and adaptability but also has risks like backtest overfit and stop loss distance setting that need attention. With further optimization, this strategy can become an effective stop loss strategy viable for live trading. It is suitable as a starting point for algorithmic trading beginners, and can be continually improved upon through practice to eventually form a unique trading system.


/*backtest
start: 2022-11-08 00:00:00
end: 2023-11-14 00:00:00
period: 1d
basePeriod: 1h
exchanges: [{"eid":"Futures_Binance","currency":"BTC_USDT"}]
*/

//Noro
//2019

//@version=4
strategy(title = "Robot WhiteBox StopMA", shorttitle = "Robot WhiteBox StopMA", overlay = true, default_qty_type = strategy.percent_of_equity, default_qty_value = 100, pyramiding = 0)

//Settings
needlong = input(true, defval = true, title = "Long")
needshort = input(false, defval = false, title = "Short")
len = input(50)
src = input(ohlc4)
elpercent = input(5.0, minval = 0, maxval = 100, title = "Shift long, %")
espercent = input(-5.0, minval = -100, maxval = 0, title = "Shift short, %")
showlines = input(true, defval = true, title = "Show lines")
showbg = input(true, defval = true, title = "Show background")

//Levels
ma = sma(src, len)
el = ma + ((ma / 100) * elpercent)
es = ma + ((ma / 100) * espercent)

//Lines
colel = showlines ? color.lime : na
colma = showlines ? color.blue : na
coles = showlines ? color.red : na
plot(el, color = colel, offset = 1)
plot(ma, color = colma, offset = 1)
plot(es, color = coles, offset = 1)

//Background
trend = 0
trend := high > el[1] ? 1 : low < es[1] ? -1 : trend[1]
colbg = showbg == false ? na : trend == 1 ? color.lime : trend == -1 ? color.red : na
bgcolor(colbg, transp = 80)

//Trading
if ma > 0
    strategy.entry("Long", strategy.long, needlong ? na : 0, stop = el)
    strategy.entry("Short", strategy.short, needshort ? na : 0, stop = es)

More