Dual EMA Crossover Trend Following Strategy with ATR and ADX Filters

Overview
This strategy uses the classic dual EMA crossover system for trend following, with additional filters from the ATR and ADX indicators, to track strong trends and control risk during consolidations.
Strategy Logic
The strategy is mainly based on the following:
-
Use a faster 8-period EMA and a slower 20-period EMA to generate crossover signals. EMAs themselves have trend-following properties.
-
The ATR indicator reflects recent volatility. Normalizing ATR allows dynamic adjustment of EMA crossover filter conditions, lowering requirements during strong trends and raising during consolidations to control risk.
-
The ADX indicator determines trend strength. An ADX reading above 30 suggests a strong trend, prompting timely stop loss.
-
Combine with bull/bear trends to determine long/short entry timing. Go long on golden crosses in a bull market, and short on death crosses in a bear market.
-
Volume filter to enter when volume expands.
-
Use a simple USD index to determine USD strength, expanding stop and take profit range during strong USD.
-
Use the SuperTrend indicator to determine overall market direction for additional long/short timing aid.
The strategy combines trend and oscillation indicators to dynamically adjust parameters, tracking trends while controlling risk.
Advantages of the Strategy
-
The dual EMA system provides trend determination, with EMA smoothness filtering false breaks.
-
ATR-normalized filters allow flexibility for different market environments.
-
ADX and volume provide additional checks to avoid whipsaws during consolidations.
-
Considering USD and SuperTrend improves decision accuracy on the macro trend.
-
Risk management automatically adapts based on USD strength.
-
Simple golden/dead cross signals and stop/take profit logic make it easy to implement and backtest.
Risks of the Strategy
-
Dual EMAs lag in detecting trend turning points.
-
Poor ATR parameter selection may be too aggressive or conservative.
-
ADX parameters need optimization, improperly set high points could miss trends.
-
USD and SuperTrend trend determination could be inaccurate.
-
Stop loss too tight increases losses, too wide risks whipsaws.
Improvement Ideas
-
Consider adding indicators like MACD for better turnover point detection.
-
Optimize ATR parameters over more historical data.
-
Test different ADX parameters and optimize high point thresholds.
-
Add more variables for USD and market trend analysis.
-
Calculate optimal stop loss percentage from backtest stats.
-
Experiment with trailing or chandelier stops.
-
Continue optimizing entry size and holding period.
Conclusion
This strategy integrates the classic dual EMA system with multiple auxiliary indicators, using parameterized optimization for a fairly robust trend following approach. It adapts flexibly to changing market environments, tracking trends while controlling risk. Further testing and optimization of stops and indicator parameters would improve results. The concepts are worth learning from and improving upon.
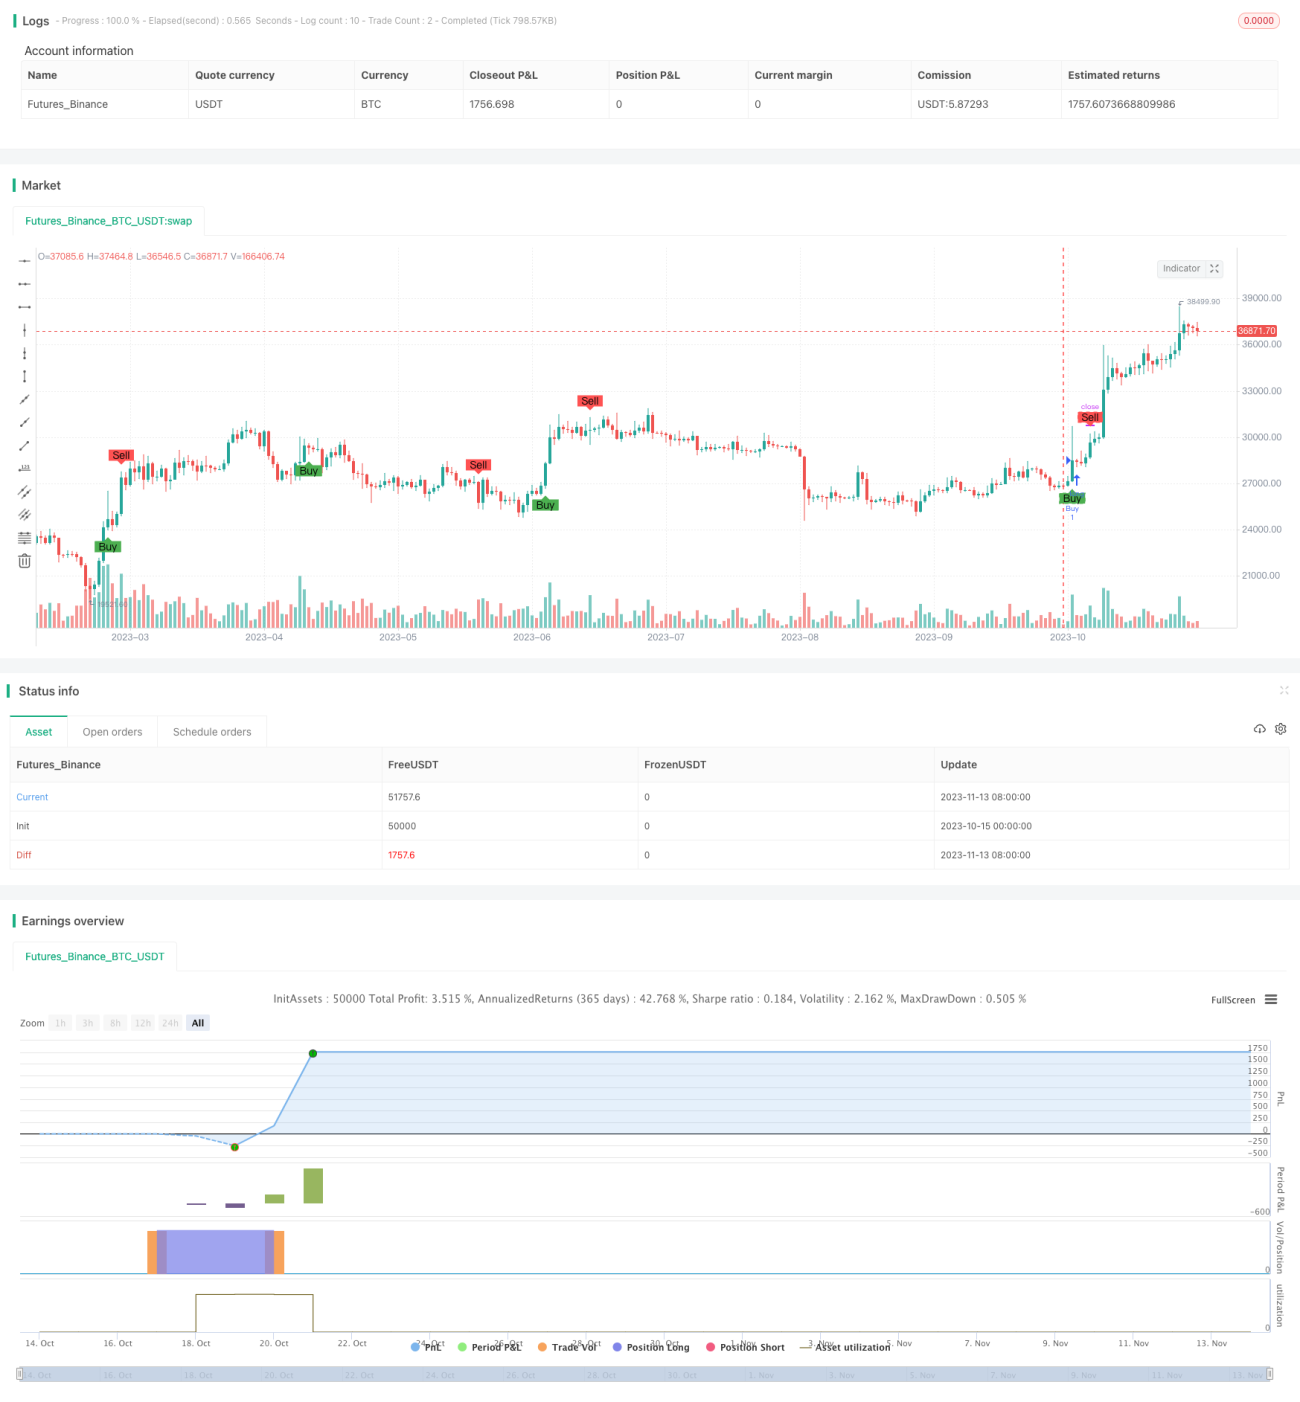
/*backtest
start: 2023-10-15 00:00:00
end: 2023-11-14 00:00:00
period: 1d
basePeriod: 1h
exchanges: [{"eid":"Futures_Binance","currency":"BTC_USDT"}]
*/

//@version=5
strategy("Refactored Advanced EMA Cross with Normalized ATR Filter, Controlling ADX", shorttitle="ALP V5", overlay=true)

// Initialize variables to track if a buy order has been placed and number of periods since the last buy- 1