Williams Fractals Dual Direction Trading Strategy

Overview
This strategy uses the Williams new highs and lows indicator to identify reversal signals, with multiple moving averages for breakout trading, and RSI to filter out false signals, enabling efficient dual direction trading.
Strategy Logic
-
The Williams new highs and lows indicator identifies turning points using the highest and lowest prices over a given period. It generates buy and sell signals.
-
The 20, 50, and 100-day moving averages form multiple moving averages. Trading signals are generated when the price breaks through two of the moving averages.
-
The RSI indicator identifies overbought and oversold zones to filter uncertain signals.
-
The strategy determines which two moving averages are broken, combines Williams indicator signals and RSI filtering to generate reliable buy and sell signals.
-
Entry rules: When the short-term MA crosses above the medium or long-term MA, and Williams new low and RSI low signals appear, go long. When the short-term MA crosses below the medium or long-term MA, and Williams new high and RSI high signals appear, go short.
-
Stop loss and take profit: Fixed percentage stop loss and take profit.
Advantages
-
Williams indicator accurately identifies key support and resistance for reversal signals.
-
Multiple moving average crossovers avoid false signals from single moving average whipsaws.
-
RSI filters help timing entry more precisely and reliably.
-
Fixed stop loss and take profit controls risk and provides clarity on P&L.
-
Combining reversal and trend indicators provides more reliable signals.
Risks
-
Inappropriate symbol selection, parameters need adjustment for different symbols.
-
Inefficient timeframe selection, parameters need tuning for different timeframes.
-
Fixed stop loss/take profit cannot adapt to market changes, may stop out or take profit prematurely.
-
Whipsaws when moving averages oscillate may generate false signals.
-
Signal lag when indicators diverge.
Enhancement Opportunities
-
Dynamic optimization of parameters for different trading instruments.
-
Introduce adaptive stop loss and take profit for better P&L.
-
Add more filters like MACD, Stochastics to reduce false signals.
-
Incorporate machine learning algorithms to automatically detect optimal entry.
-
Integrate more trend indicators to identify trending conditions.
Summary
This strategy combines Williams, moving averages, RSI and other technical analysis tools, using dual confirmation to reduce false signals and effectively capture reversals, with fixed stop loss/take profit to control risk. Overall a reliable and practical dual direction trading system. Next steps are further performance improvement through parameter optimization, stop loss/take profit enhancements and ensemble modeling.
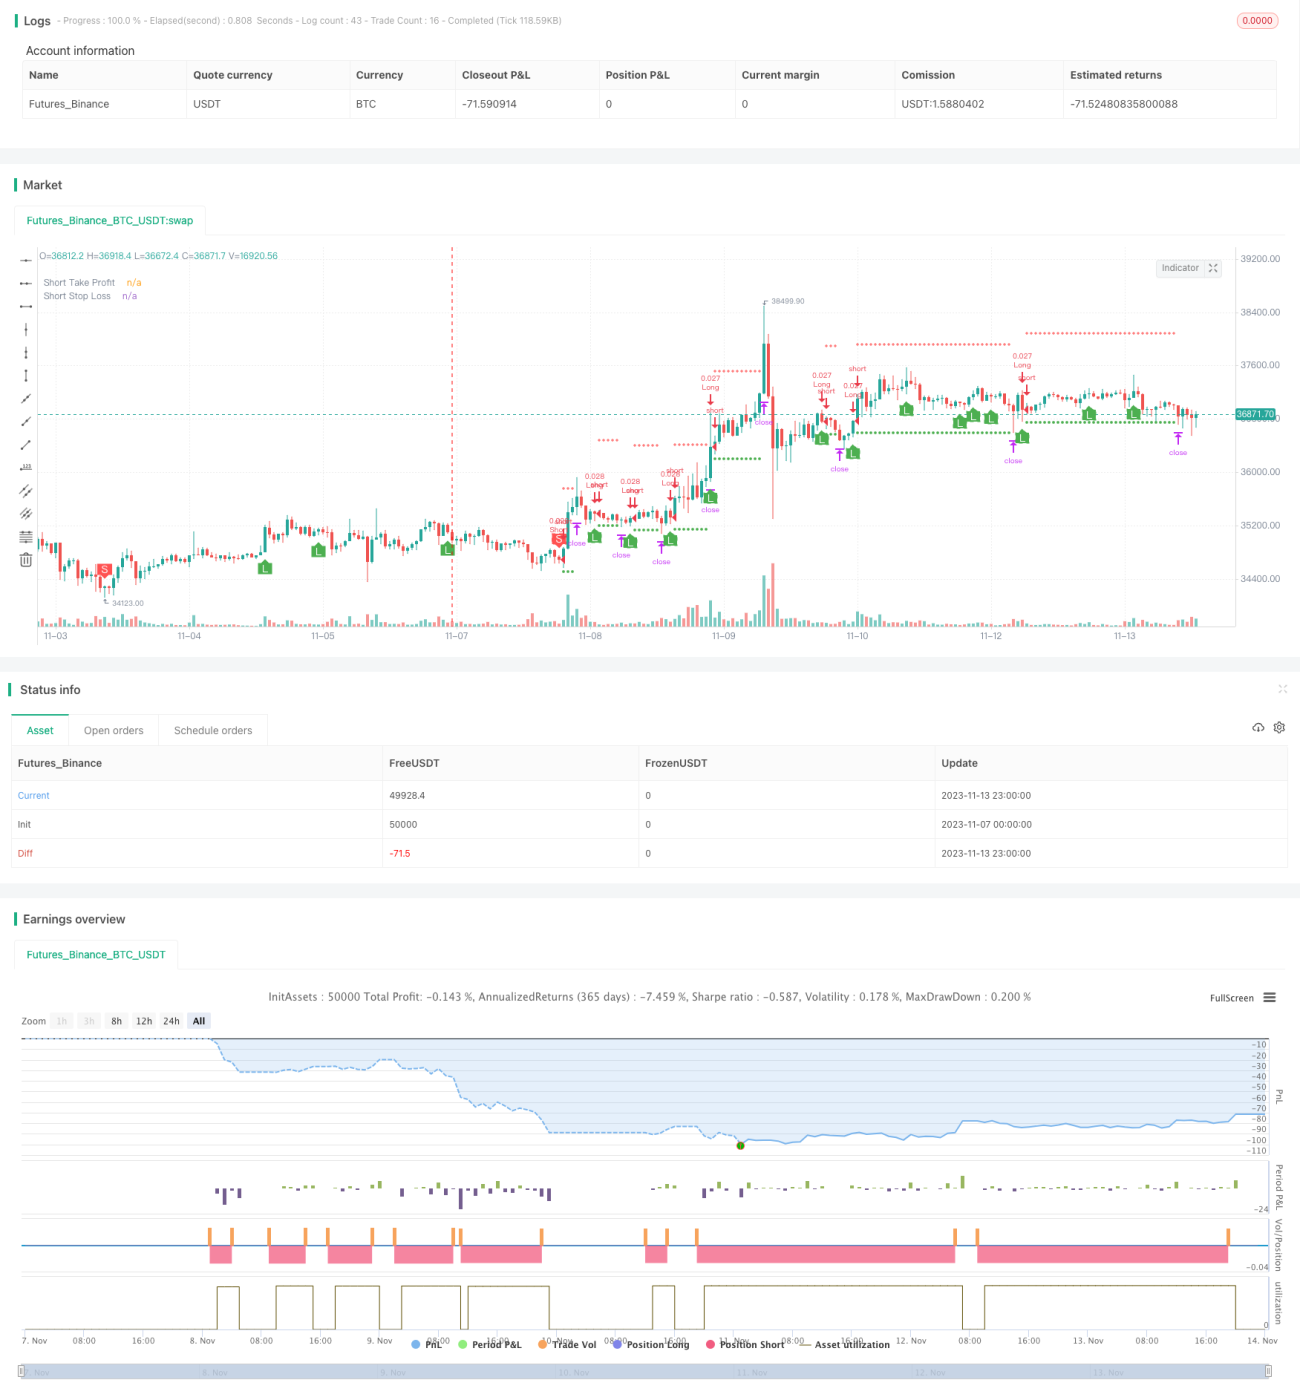
/*backtest
start: 2023-11-07 00:00:00
end: 2023-11-14 00:00:00
period: 1h
basePeriod: 15m
exchanges: [{"eid":"Futures_Binance","currency":"BTC_USDT"}]
*/

// This source code is subject to the terms of the Mozilla Public License 2.0 at https://mozilla.org/MPL/2.0/
// © B_L_A_C_K_S_C_O_R_P_I_O_N
// v 1.1
- 1