Momentum Reversal RSI Strategy

Overview
This is a short-term trading strategy based on the Relative Strength Index (RSI) indicator. It utilizes RSI to identify overbought and oversold levels and combines candlestick filtering to avoid false signals, entering long and short positions at reversal points. The strategy aims to capture mean-reversion opportunities after extreme overbought or oversold conditions.
Strategy Explanation
Logic
Firstly, the RSI indicator is calculated based on the closing price with a period set to 7. The overbought level is set at 70 and the oversold level is set at 30. Buy signals are generated when RSI crosses above 30 and sell signals are generated when RSI crosses below 70.
To filter out false signals, the candlestick body size needs to expand to 1-3 times of the normal range when a trading signal is triggered. Here the strategy requires 1-5 consecutive RSI bars staying in overbought or oversold levels to confirm the signal, with body expansion set to 4 times.
When RSI stays below 30 for 5 consecutive bars, a long signal is generated. If the next candle shows a bullish body expanded more than 4 times, a long position will be executed. When RSI stays above 70 for 5 consecutive bars, a short signal is generated. If the next candle shows a bearish body expanded more than 4 times, a short position will be executed.
To lock in profits, positions will be closed when the current candle direction is consistent with the position direction and the body expands 2 times.
Advantages
- Capturing mean-reversion after extreme levels
RSI is good at identifying overbought and oversold conditions. When a stock reaches extreme levels, there is high probability of a pullback, and extreme levels often imply an impending reversal. This strategy is able to capture such opportunities at turning points.
- Candlestick filtering decreases false signals
Trading purely based on RSI signals may result in many false signals. This strategy incorporates candlestick body expansion as a filter, entering positions when an enlarged body appears around reversal points, avoiding whipsaws from chaotic markets.
- Consecutive RSI bars increase reliability
Requiring 1-5 consecutive RSI bars in overbought or oversold zone acts as a confirmation, avoiding false signals from occasional aberrant bars and improving signal reliability.
- Flexible body expansion multiplier
The body expansion multiplier can be adjusted for different products. For stocks with large swings, the criteria can be relaxed, while for stocks with narrow ranges, it can be tightened. This allows flexible adjustments for different trading products.
Risks
- Potential overfitting
The parameter settings have some inherent limitations. Different products and time periods may require parameter tuning. Using fixed settings may lead to overfitting issues.
- Low accuracy in identifying turns
RSI itself has some lagging properties. Combining with body expansion exits positions prematurely. So the accuracy of catching exact bottoms or tops is generally not very high.
- Potentially long holding period in ranging markets
In ranging markets, RSI may trigger frequent buy and sell signals, resulting in long holding periods. Parameters should be adjusted or the strategy should be temporarily stopped in such cases.
- Need proper position sizing strategies
As a short-term trading strategy, proper position sizing strategies should be combined, such as moving stop loss, take profit, etc, to lock in profits and control risks.
Improvement Ideas
- Test different parameter sets
Different combinations of RSI parameters can be tested, such as period, overbought/oversold levels, and candlestick filters, to find optimized parameters for different products.
- Add stop loss and take profit
Moving or percentage stop loss can be added to lock in profits. Or set stop loss based on ATR values or Donchain channels etc.
- Combine other indicators as filters
Conditions based on MACD, KDJ and other indicators can be added to avoid wrong signals from invalid breakouts. Volatility indicators can also help identify reversal signals in trends.
- Add trend bias
Use moving averages to gauge trend bias. Only consider trading signals that align with the trend. The strategy can be paused during range-bound markets. Trend strength indicators can also be used as filters.
Conclusion
In summary, this RSI reversal strategy is a typical short-term trading strategy with its own pros and cons. The main advantage lies in capturing pullbacks after extremes while the main risk comes from low signal precision and long holding periods in ranges. We can improve the strategy by adjusting parameters, adding filters, optimizing stops, etc, to adapt to more products and market conditions, and achieve more steady results.
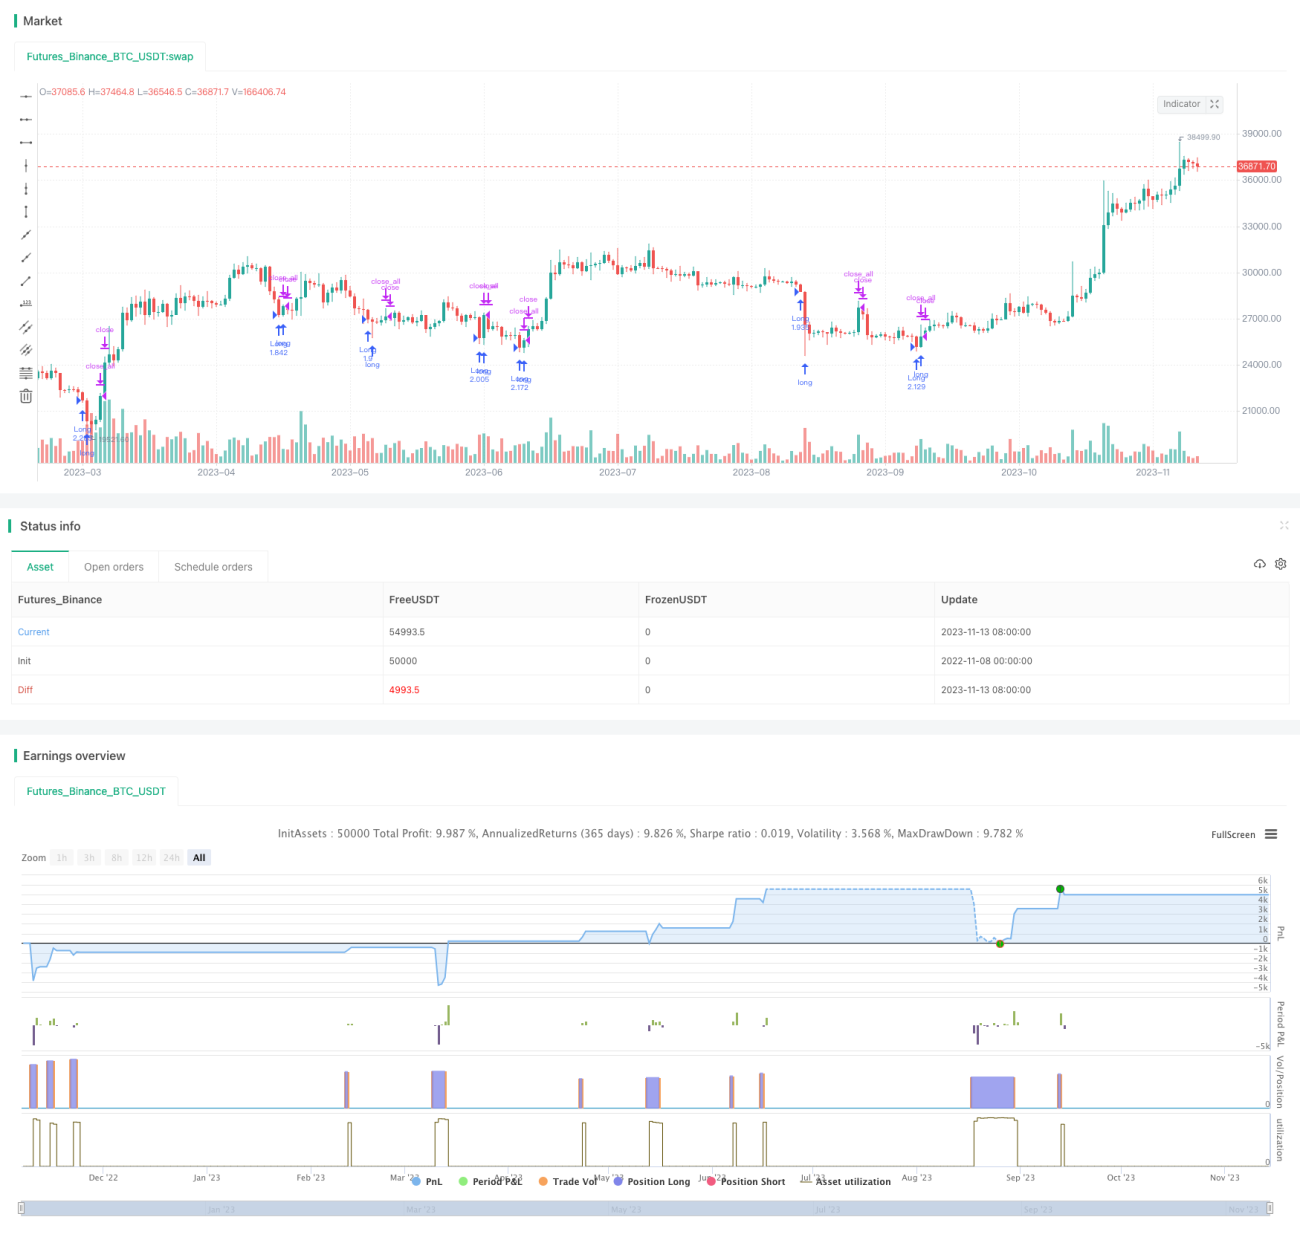
/*backtest
start: 2022-11-08 00:00:00
end: 2023-11-14 00:00:00
period: 1d
basePeriod: 1h
exchanges: [{"eid":"Futures_Binance","currency":"BTC_USDT"}]
*/

//@version=3
strategy(title = "Noro's FRSI Strategy v1.21", shorttitle = "FRSI str 1.21", overlay = true, default_qty_type = strategy.percent_of_equity, default_qty_value = 100, pyramiding = 0, commission_type = strategy.commission.percent, commission_value = 0.0)

//Settings- 1