Dual Moving Average Crossover Intraday Futures Trading Strategy

Overview
This strategy utilizes the principle of dual moving average crossover, incorporates ATR indicator for stop loss and take profit, and adds trading hour control to design an intraday trading strategy suitable for futures contracts. The strategy is simple and easy to grasp, making it ideal for beginners.
Strategy Logic
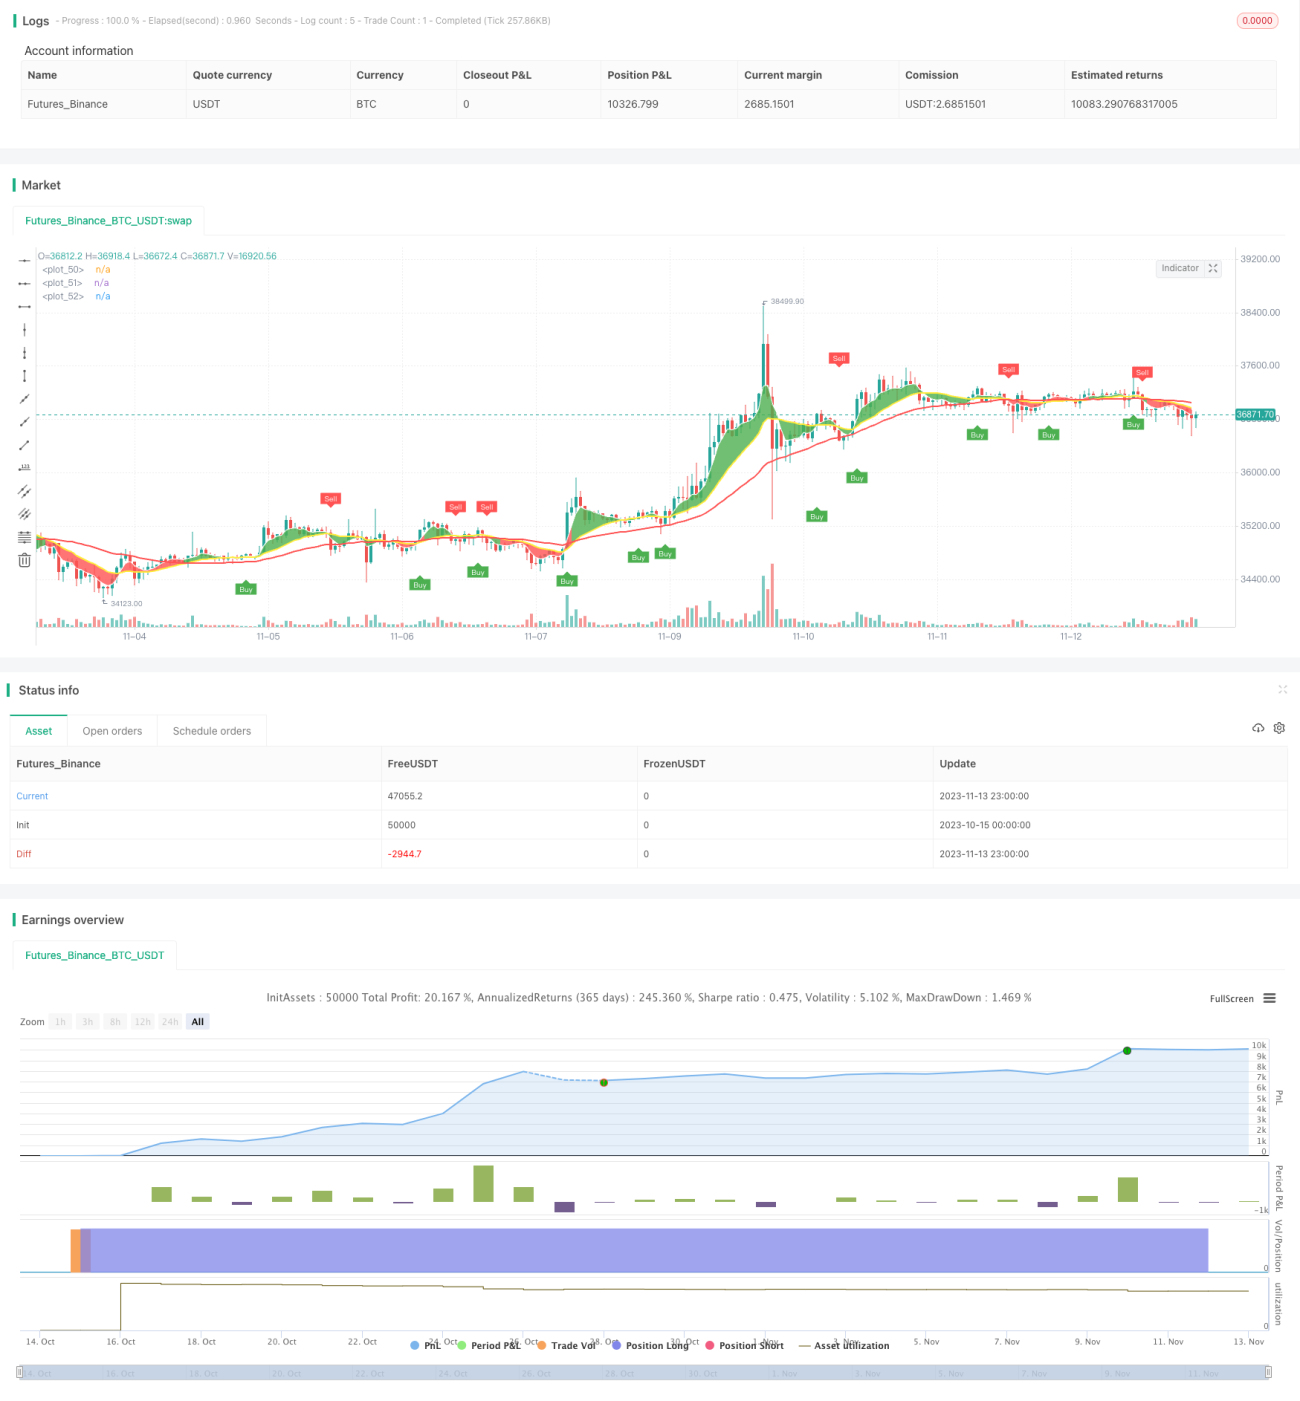
The strategy uses 5-period and 20-period WMA lines crossover as entry signals. It goes long when 5-period line breaks above 20-period line, and goes short when 5-period line breaks below 20-period line. It also uses 50-period WMA line to determine the trend direction. Trading signals are only triggered when price breakout direction is consistent with the major trend.
In addition, the strategy leverages ATR indicator to set dynamic stop loss and take profit levels. ATR reflects the volatility of the market. The strategy uses ATR value multiplied by a factor (such as 3) to determine stop loss and take profit, thereby controlling per trade loss.
Finally, the strategy only triggers trades during US trading hours (9:00-14:30 CST) to avoid high volatility around market open and close where false signals easily form.
Advantage Analysis
The strategy has the following advantages:
-
Dual moving average crossover effectively captures trend turning points for timely entry.
-
Trend filter avoids trading against major trend and reduces false signals.
-
Dynamic ATR-based stop loss controls per trade loss.
-
Limiting trading hours avoids volatile open and close periods.
-
Simple and clear rules, easy to understand and implement for beginners.
-
Customizable parameters like MA periods, ATR multiplier, trading hours etc. for optimization.
Risk Analysis
The strategy also has the following risks:
-
More stop loss triggers during range-bound markets.
-
Dual MA crossover has lag and may miss short-term breakouts.
-
Improper ATR parameter setting leads to large or small stop loss.
-
Rely solely on technical indicators without fundamental analysis.
-
Effectiveness relies on proper symbol and timeframe.
-
Mechanical system has risk of being arbitraged.
-
Parameters need adjustment for different trading sessions.
These can be improved via parameter tuning, indicator combinations, selective manual intervention etc.
Optimization Directions
The strategy can be enhanced in the following aspects:
-
Test different MA systems like EMA, DMA etc.
-
Add other technical filters like MACD, RSI etc.
-
Optimize ATR parameters for better stop loss/profit.
-
Incorporate volume indicators to find high quality entry signals.
-
Adjust parameters based on symbol specifics.
-
Integrate fundamental factors to avoid trading against market.
-
Introduce machine learning like neural networks for market modeling.
-
Explore multi-timeframe combinations for more opportunities.
-
Construct strategy ensemble to improve robustness.
Conclusion
In summary, this is a simple and intuitive strategy suitable for beginners to practice live trading. At the same time, huge room remains for optimization via more technical indicators or machine learning. Parameter tuning based on symbol and market dynamics is also key. The strategy provides a reference framework for quant trading beginners, but requires relentless testing and enhancement for stable profits.
- 1