Trend Following Energy Indicator Trading Strategy

Overview
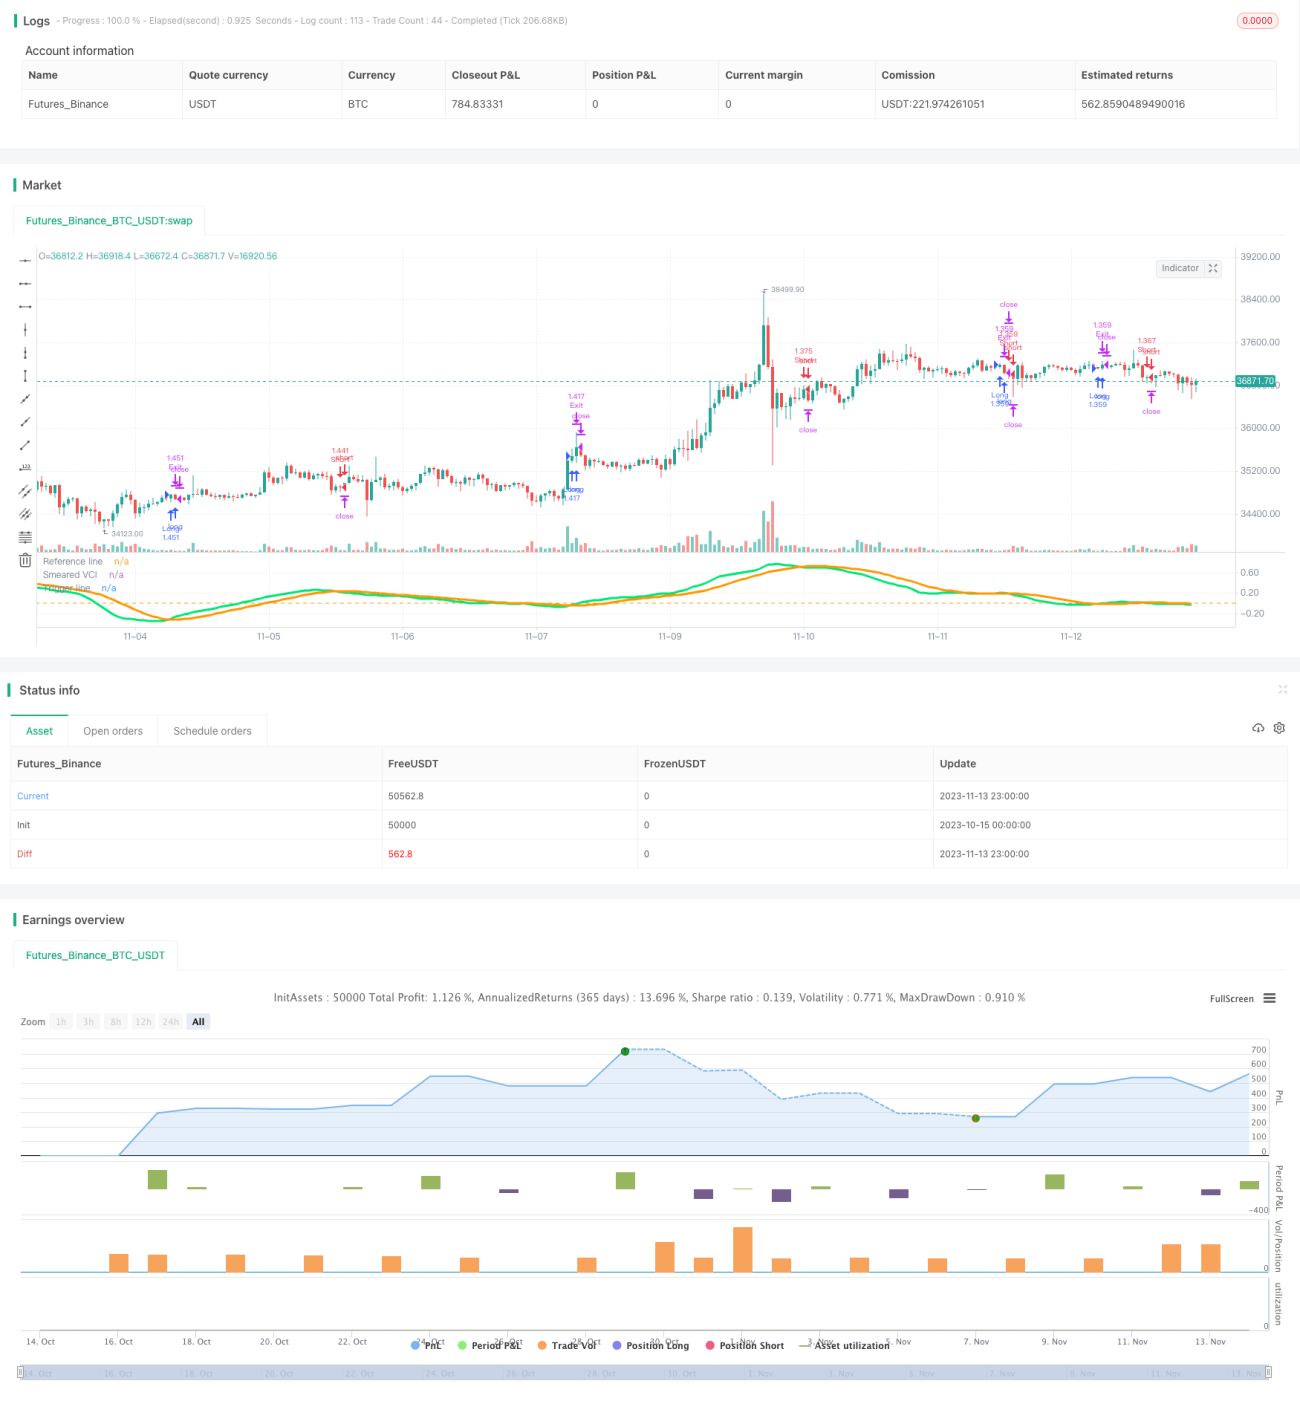
This strategy is a trend following strategy that trades based on the Smeared Variability Channel Index (Smeared VCI) indicator by vitelot. It combines the trend judgment of moving averages and the overbought/oversold judgment of VCI to capture the main trend direction of prices. When prices run into overbought or oversold status, reverse operations are taken to profit.
Strategy Logic
The strategy uses vitelot's Smeared VCI indicator to determine the trend direction. Smeared VCI indicator is a smoothed VCI (Variability Channel Index). It consists of three parameters: fast EMA, slow EMA and smoothing period. When fast EMA is above slow EMA, it is bullish, otherwise it is bearish. The smoothing process filters out some noise.
There are two conditions set in the strategy:
-
Smeared VCI crossing above Trigger line is long signal, and crossing below is short signal.
-
Only trade within the backtest time window.
When both conditions are met, long or short position will be taken. Exit when stop loss is triggered or reverse signal appears.
Advantage Analysis
The advantages of this strategy are:
-
Using a trend following indicator, it can effectively track trends.
-
The smoothing process reduces false signals.
-
Backtesting within a time window focuses on specific period.
-
Stop loss set controls risk.
-
Using indicator parameters for long/short decision makes the rules simple and clear.
Risk Analysis
There are also some risks in this strategy:
-
Trend judgment may be wrong, leading to losses.
-
Improper indicator parameters setting may lead to poor profitability.
-
Too small stop loss setting may result in being stopped out quickly.
-
Improper backtest time window may lead to biased test results.
-
Too frequent long/short switching may bring about commission pressure.
Optimization Directions
The strategy can be optimized in the following aspects:
-
Test different parameter combinations to find the optimal parameters.
-
Use other indicators for confirmation to improve accuracy.
-
Optimize the stop loss algorithm to achieve dynamic trailing stop loss.
-
Optimize entry conditions to avoid overtrading.
-
Test longer time windows to verify stability.
-
Incorporate other factors like volume to improve decision accuracy.
Summary
In summary, this is a relatively simple trend following strategy. It uses the Smeared VCI indicator to determine trend direction and open positions when trading signals are generated. Risk is controlled by stop loss. The strategy has trend following capability but also has some risks. Further improvements can be made through parameter optimization, stop loss optimization and adding confirming conditions to make it a stable and reliable trading system.
/*backtest
start: 2023-10-15 00:00:00
end: 2023-11-14 00:00:00
period: 1h
basePeriod: 15m
exchanges: [{"eid":"Futures_Binance","currency":"BTC_USDT"}]
*/

//@version=3
strategy("Smeared VCI Backtest", overlay=false, shorttitle="SVCI Backtest", default_qty_type = strategy.percent_of_equity, default_qty_value = 100, initial_capital = 10000, slippage = 5)
// Smeared Variability Channel Index
// a variation of the VCI indicator of the same author.- 1