概述
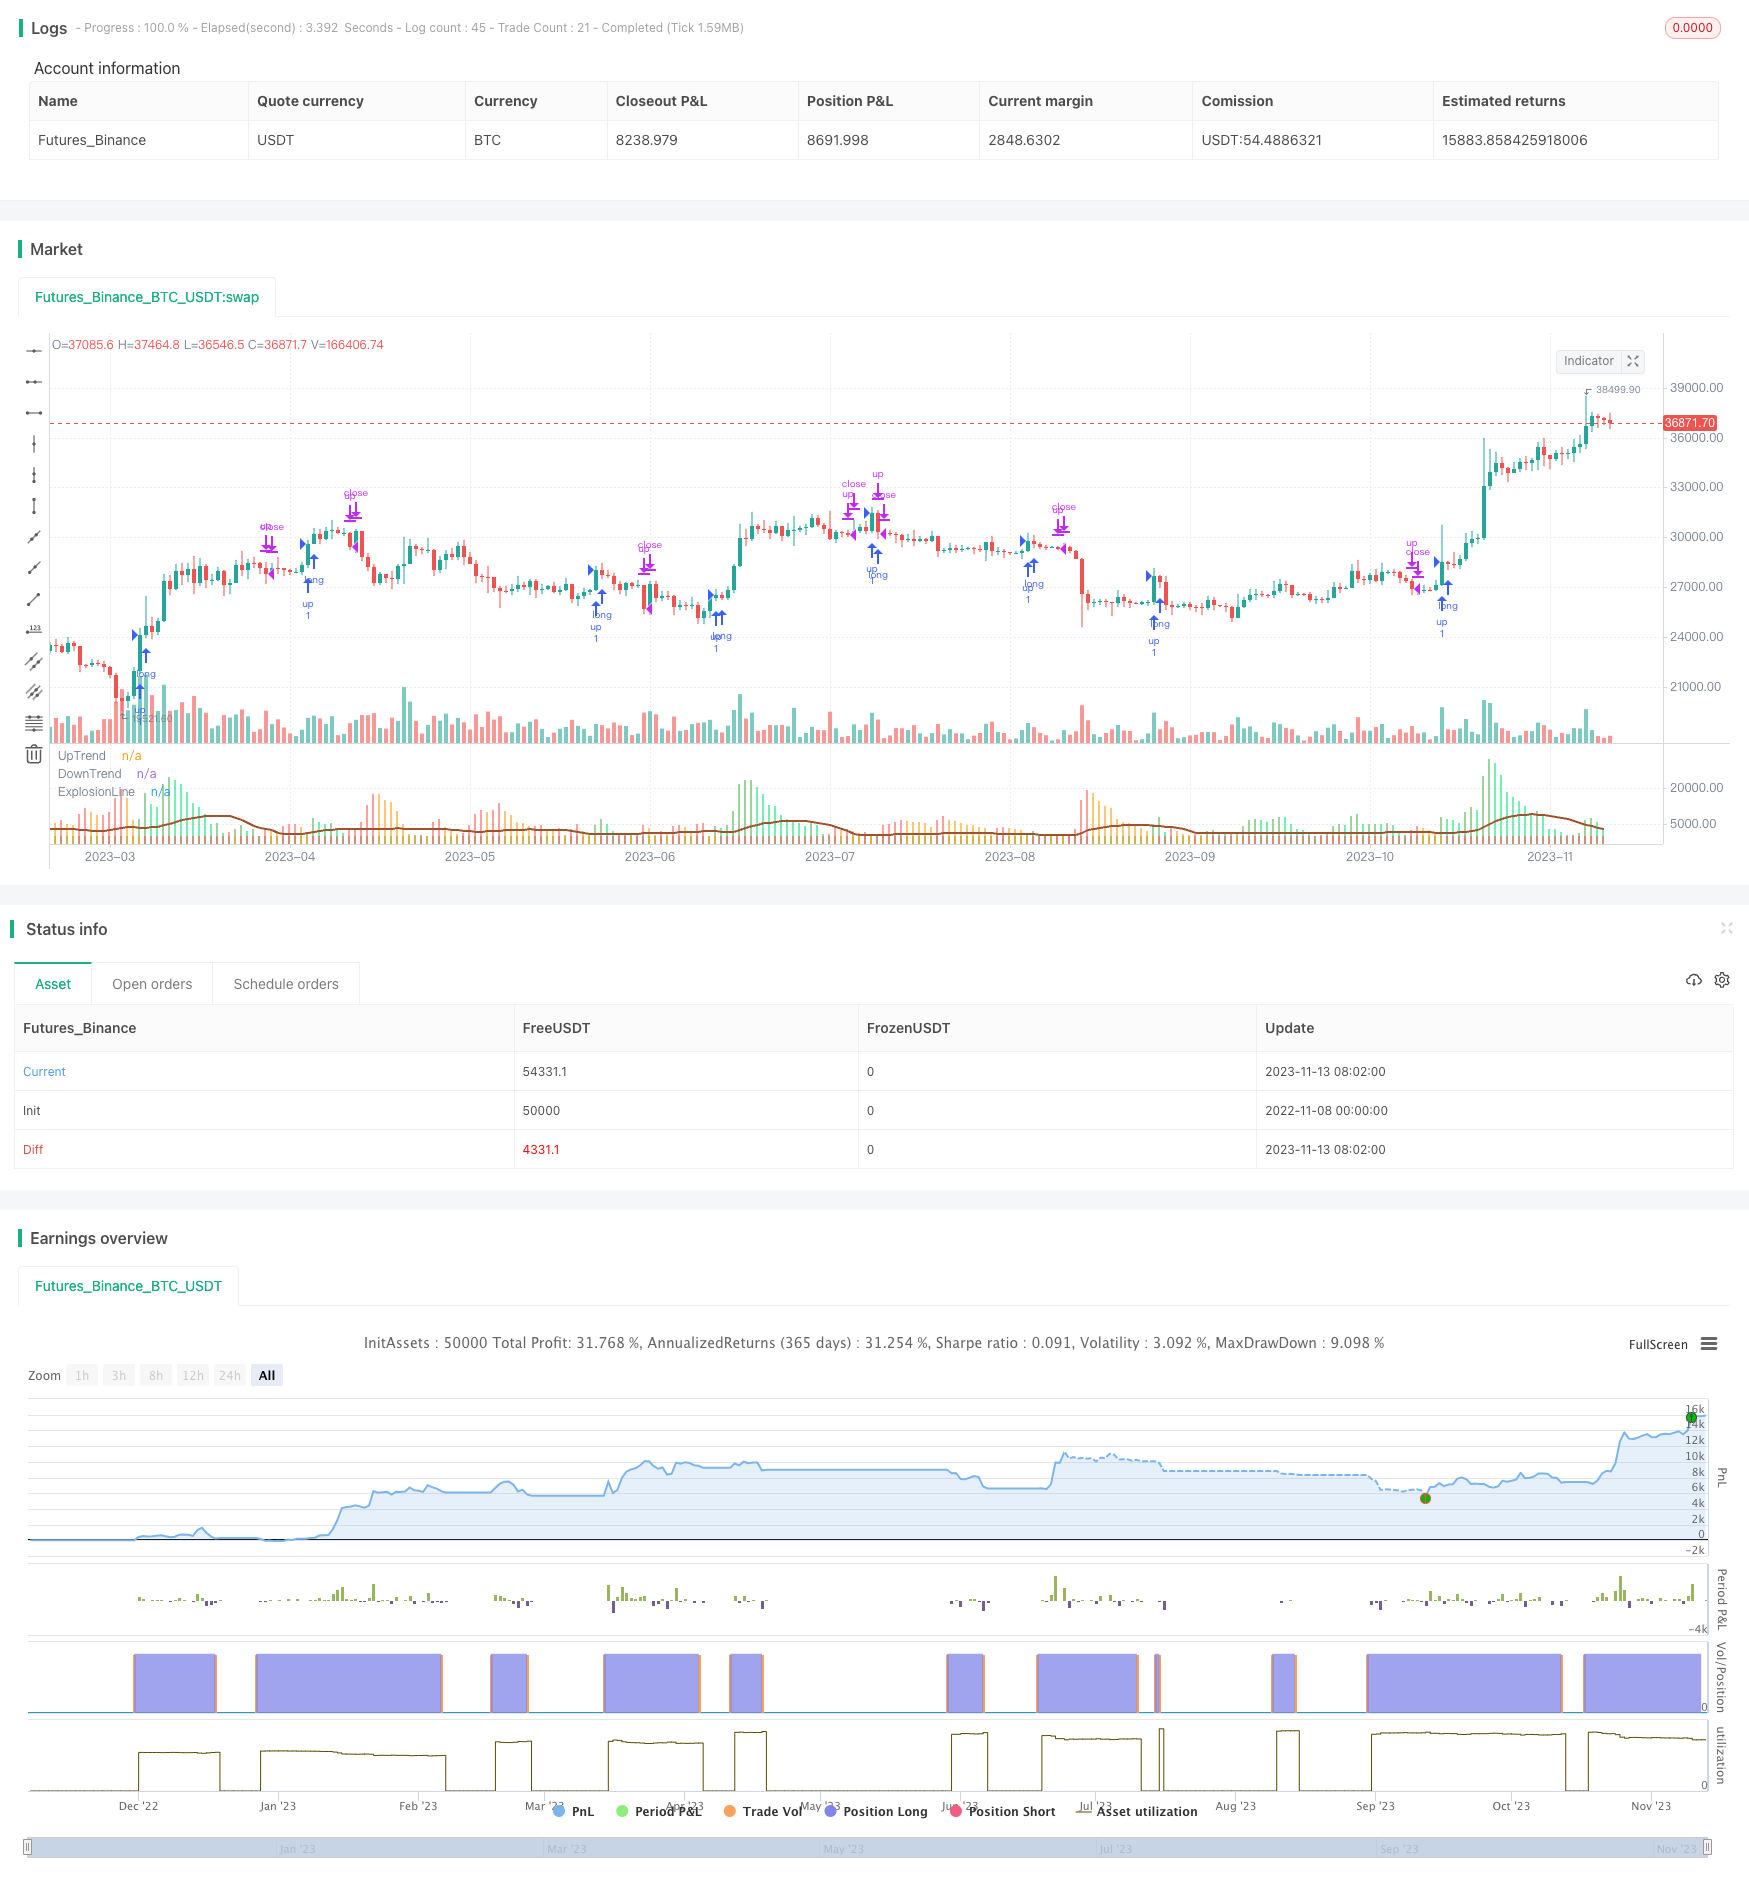
本策略基于动态马克均线的指标,结合布林带和RSI进行交易信号过滤,实现了一个只做多不做空的趋势跟踪策略。该策略通过计算海克线收盘价的动态马克均线变化来判断趋势,并与布林带比较来发出交易信号。结合RSI过滤器,可以有效识别趋势的爆发点,实现趋势跟踪。
策略原理
本策略的核心是计算海克线收盘价的动态马克均线的变化。具体来说,是计算当前K线与前两个K线的马克均线差值,再乘以灵敏度系数,得到准确的马克均线变化值。
然后,将这个变化值与布林带的上轨和下轨的差值进行比较。如果马克均线变化大于布林带差值,则认为趋势出现“爆发”。当该爆发是正的,即马克均线变化为正,则产生做多信号和绿色柱状线。当爆发是负的,即马克均线变化为负,则产生平仓信号和红色柱状线。
此外,该策略还设置了RSI过滤器,只有当RSI高于阈值时才会发出做多信号,从而避免趋势反转的风险。
策略优势
- 利用动态马克均线判断趋势,可以有效跟踪趋势的变化
- 布林带作为动态指标,结合马克均线,可以更好地识别趋势爆发
- RSI过滤器可以避免低位反弹带来的假信号
- 只做多不做空,适合持续上涨的牛市
- 可调参数灵活,可针对不同品种和周期进行优化
策略风险
- 只做多不做空,无法获利于下跌行情
- 过于依赖参数优化,不同品种和周期需要重新测试
- 无法有效捕捉趋势反转,可能带来较大亏损
- RSI过滤器设置不当可能错过交易机会
- 高参数灵敏度容易产生噪音交易
风险缓解措施包括:适当调整参数使之更稳健、结合其它指标判断趋势反转、只在长线清晰趋势中使用等。
策略优化方向
本策略还有一定的优化空间:
尝试不同的价格源,如收盘价、均线等,以获得更好的平滑效果
调整马克均线和布林带的周期参数,优化针对不同品种
尝试比例关系替代灵敏度系数,使指标结果更直观
增加其它过滤器,如趋势均线、交易量等,提高信号质量
开发空头策略,根据指标形态进行逆向操作
加入止损机制,更好地控制风险
总结
本策略总体来说是一个较为稳定的趋势跟踪策略。它利用动态均线判断趋势方向,布林带识别爆发点,RSI过滤假信号,实现了一个只做多的趋势系统。但也存在一定的风险,需要针对不同品种和周期进行参数优化,且无法获利于下跌行情。本策略还有进一步提高信号质量、开发空头策略、加入止损等优化空间,以获得更好的绩效。
策略源码
/*backtest
start: 2022-11-08 00:00:00
end: 2023-11-14 00:00:00
period: 1d
basePeriod: 1h
exchanges: [{"eid":"Futures_Binance","currency":"BTC_USDT"}]
*/

//@version=5

///////////Original Script Courtesy of Lazy_Bear.... Absolute Legend\\\\\\\\\\\\\\\

strategy('SmoothedWaddah', overlay=false, initial_capital=1)
sensitivity = input(150, title='Sensitivity')
fastLength = input(20, title='MacD FastEMA Length')
slowLength = input(40, title='MacD SlowEMA Length')
channelLength = input(20, title='BB Channel Length')
mult = input(1.5, title='BB Stdev Multiplier')
RSI14filter = input(40, title='RSI Value trade filter')

////////////MacD Calculation of price//////////////////////////////
calc_macd(source, fastLength, slowLength) =>
    fastMA = ta.ema(source, fastLength)
    slowMA = ta.ema(source, slowLength)
    fastMA - slowMA

/////////BolingerBand Calculation of Price///////////////////////
calc_BBUpper(source, length, mult) =>
    basis = ta.sma(source, length)
    dev = mult * ta.stdev(source, length)
    basis + dev

calc_BBLower(source, length, mult) =>
    basis = ta.sma(source, length)
    dev = mult * ta.stdev(source, length)
    basis - dev

//////heinkenashi chart call for closing price "smoothing mechanism"\\\\\\\\\\\\\\\\\\\\\\\\\\\
point = request.security(ticker.heikinashi(syminfo.tickerid), timeframe.period, close)

////////////////////T1 is change in MacD current  candle from previous candle Sensitivy amplifies calculation/////////////////////
t1 = (calc_macd(point, fastLength, slowLength) - calc_macd(point[1], fastLength, slowLength)) * sensitivity
//////////////////////T2 is  T1 from two candles prior\\\\\\\\\\\\\\\\\\\\\\\\\\\
t2 = (calc_macd(point[2], fastLength, slowLength) - calc_macd(point[3], fastLength, slowLength)) * sensitivity

////////////////E1 is difference in bolinger band upper and lower...E2 is E1 from one candle prior not needed//////////////
e1 = calc_BBUpper(ohlc4, channelLength, mult) - calc_BBLower(ohlc4, channelLength, mult)
//e2 = (calc_BBUpper(close[1], channelLength, mult) - calc_BBLower(close[1], channelLength, mult))

//////signal bar printing.. Up if MacD positive .. Down if MacD negative//////////
trendUp = t1 >= 0 ? t1 : 0
trendDown = t1 < 0 ? -1 * t1 : 0

///////plots difference in macD*Sensitivity, color change if increasing or decreasing.
//////color is green/lime if explosion is up \ color is red/orange if explosion is down/////////
plot(trendUp, style=plot.style_columns, linewidth=1, color=trendUp < trendUp[1] ? color.new(color.lime,45) : color.new(color.green,45), title='UpTrend')
plot(trendDown, style=plot.style_columns, linewidth=1, color=trendDown < trendDown[1] ? color.new(color.orange,45) : color.new(color.red,45), title='DownTrend')
plot(e1, style=plot.style_line, linewidth=2, color=color.new(#A0522D, 0), title='ExplosionLine')


////////////Entry conditions and Concept/////////////////////
////////////Long Only System. T1 is measuring the distance between MACD EMA's. This is Multiplied
////////////by the sensitivity so that it can be compared to the difference between BollingerBand.
/////////////{this could have been a ratio maybe i will work with that in a different script.}
/////////////I found that 135-175 sensitivy allows for values to be compared on most charts.....
////////////If the (difference between the EMA)*(Sensitivity) is greater than (BB upper line- BB lower line)
////////////it is considered an explosion in either the downside or the upside.The indicator will print
///////////a bar higher than the trigger line either green or red (up or down respectively)//////////////////

longCondition = trendUp > e1 and ta.rsi(close, 14) > RSI14filter
if longCondition
    strategy.entry('up', strategy.long)

strategy.close('up', trendDown > e1)