Oscillation Strategy of High and Low TEMA Average

Overview
This strategy uses TEMA, VWMACD and HMA indicators to capture the downtrend of Bitcoin. Its main logic is to go short when VWMACD crosses below 0, price is below HMA and fast TEMA is below slow TEMA. It will exit the position when VWMACD crosses above 0, price is above HMA or fast TEMA crosses above slow TEMA.
Principle
First calculate VWMACD (the only difference from regular MACD is the way to calculate moving average) and plot it as histogram. Then add HMA as a trend filter. After that create and add fast TEMA (5 periods) and slow TEMA (8 periods), and calculate the difference between them to plot around 0. This is the key decision for going short.
The specific entry rule is: when VWMACD is below 0, price is below HMA and fast TEMA is below slow TEMA, go short.
The specific exit rule is: when VWMACD crosses above 0, price is above HMA or fast TEMA crosses above slow TEMA, close position.
Advantage Analysis
- Uses a combination of three indicators, improves reliability of trading signals.
- VWMACD can identify divergences and provide accurate trend judgements.
- HMAfilt as a trend filter, avoids noise interference.
- Fast and slow TEMA combo catches short-term reversal points.
- Adopts short-period parameters, suitable for high frequency trading, catches short-term downtrends.
Risk Analysis
- Multiple indicators combo, complex parameter tuning needed.
- Although having HMA filter, still need to prevent false breakouts in ranging markets.
- Short periods prone to market noise interference, wrong signals may occur.
- Need strict stop loss to prevent unexpected large losses.
- Need to focus on transaction cost control, high frequency trading easily hurt by friction.
Optimization Directions
- Can test different parameter combinations to find optimal parameters.
- Can add other indicators like RSI, KD for assistance.
- Can use adaptive parameters according to different market conditions.
- Can optimize stop loss strategy, like trailing stop loss.
- Can combine with volume indicators to avoid insufficient thrust.
Conclusion
This strategy uses the combination of VWMACD, HMA and fast/slow TEMA to capture short-term downtrends of Bitcoin. Its advantages are relatively reliable signals and suitability for high frequency trading. But it also has risks like complex parameter tuning, prone to noise interference. Further optimizing parameter combos and adding auxiliary indicators can make the strategy more stable and reliable. Overall, by utilizing multiple indicator confirmation and short period parameters, this strategy can make relatively accurate judgements on Bitcoin's short-term downtrends, and is an effective high frequency short strategy.
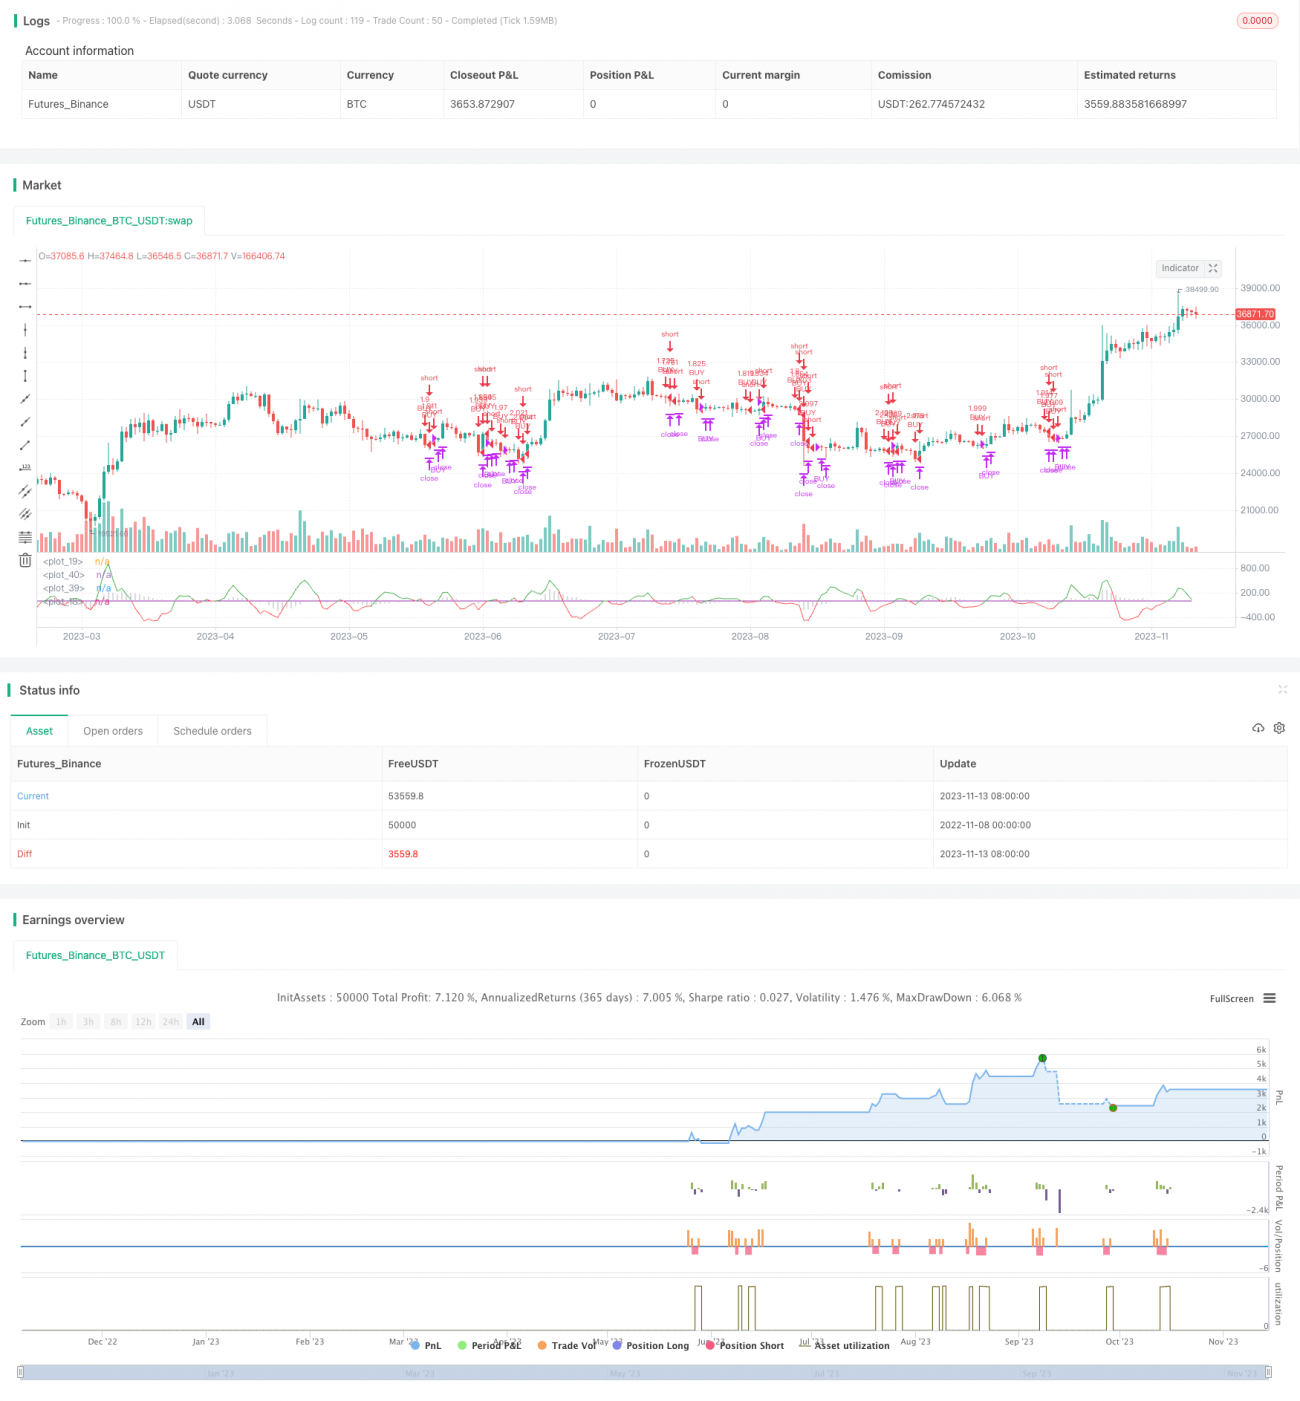
/*backtest
start: 2022-11-08 00:00:00
end: 2023-11-14 00:00:00
period: 1d
basePeriod: 1h
exchanges: [{"eid":"Futures_Binance","currency":"BTC_USDT"}]
*/

//@version=4
strategy(title="TEMA_HMA_VWMACD short strategy", shorttitle="Short strategy", overlay=false, default_qty_type=strategy.percent_of_equity, default_qty_value=100, commission_type=strategy.commission.percent, commission_value=0.018, currency='USD')
startP = timestamp(input(2017, "Start Year"), input(12, "Month"), input(17, "Day"), 0, 0)
end = timestamp(9999,1,1,0,0)- 1