Momentum Ichimoku Cloud Trading Strategy

Overview
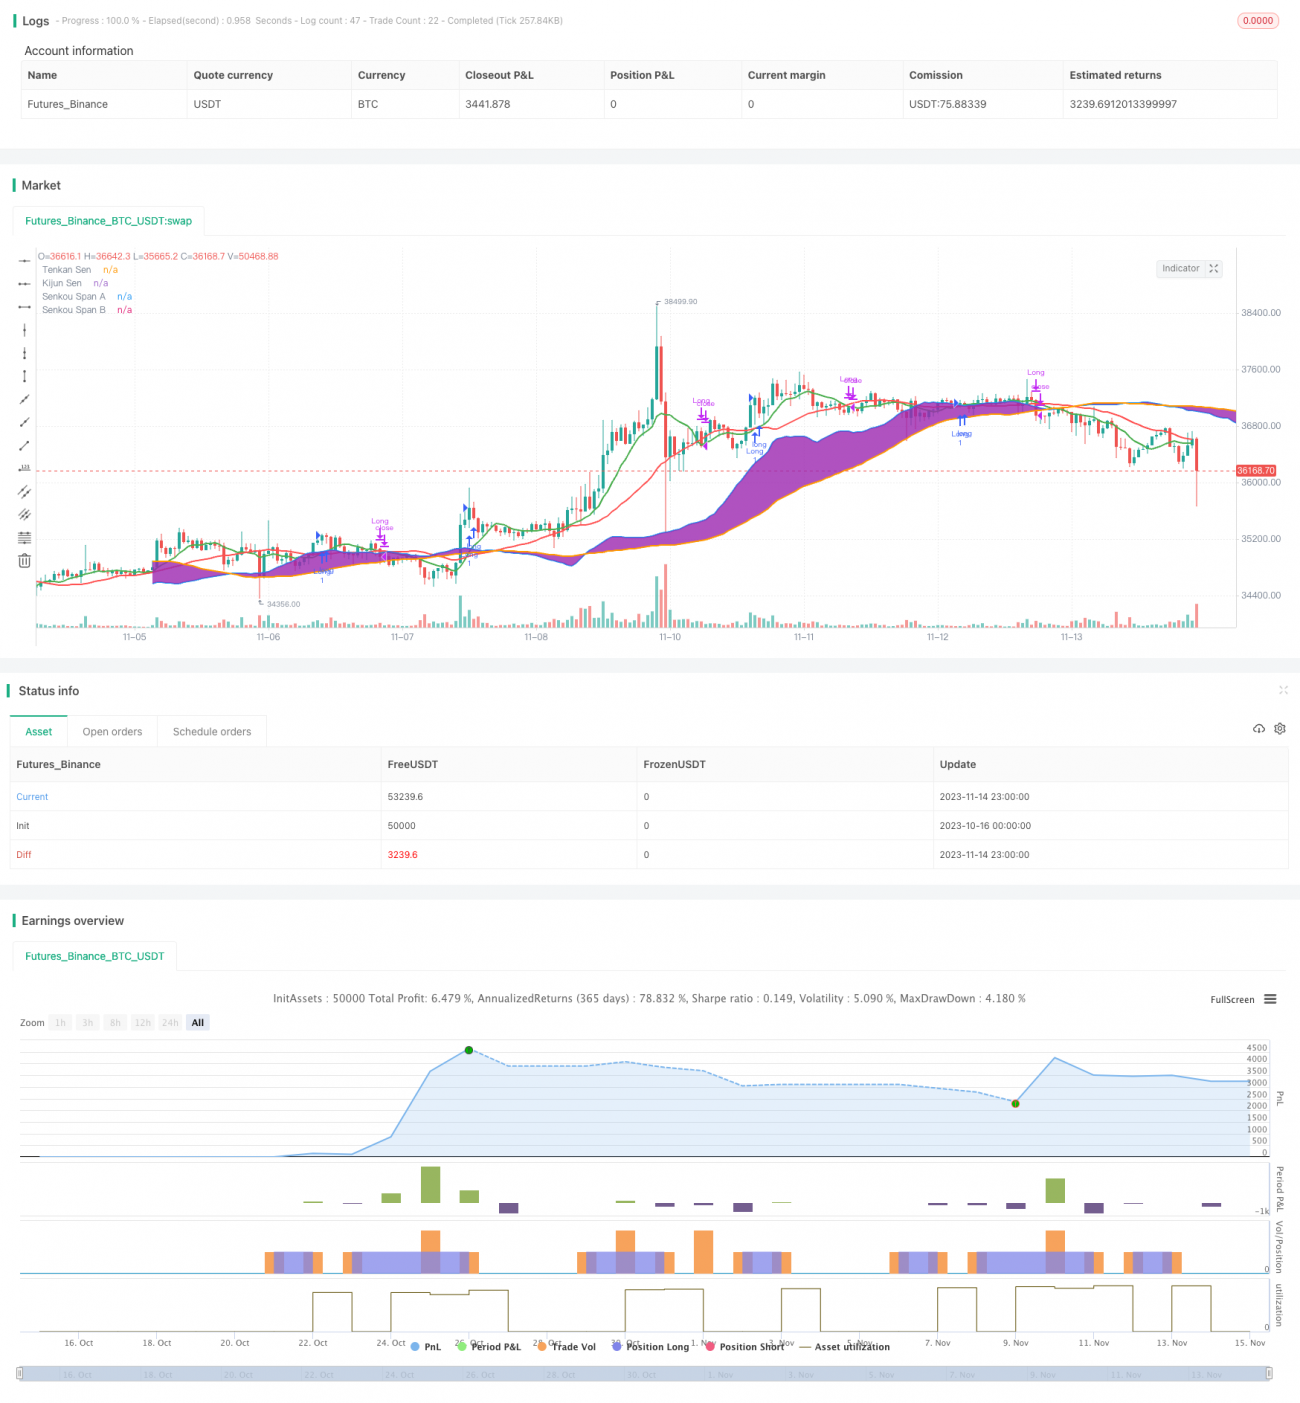
This strategy utilizes the golden cross and dead cross signals formed by the conversion and base lines of the classic Ichimoku Kinko Hyo indicator to determine the market trend direction and discover potential buy and sell opportunities. A buy signal is generated when the conversion line crosses above the base line, while a sell signal is generated when it crosses below. Integrating the Senkou Span B line of the Ichimoku cloud identifies the longer-term trend direction and effectively filters out some undesirable trade signals.
Strategy Logic
The strategy is based on the following main principles:
-
The conversion line of the Ichimoku indicator represents recent price momentum, while the base line represents the mid-to-long-term price trend. A crossover of the conversion line above the base line indicates stronger near-term momentum versus the longer-term trend, presenting a good opportunity to enter trades. Conversely, a crossover below implies a need to be cautious of closing out trades.
-
The Senkou Span B line of the Ichimoku cloud is effective at gauging the direction of the longer-term trend. Trade signals are only generated when the Span B direction aligns with the signal, avoiding random trades against the major trend.
-
Combining the crossover signals and Ichimoku cloud judgment allows capitalizing on strong pullback opportunities in an upward trending market for outsized gains.
-
If price breaks the Senkou Span A or Senkou Span B after a buy trigger, the mid-to-long-term trend is considered changed, necessitating a stop loss exit.
Advantages
The key advantages of this strategy include:
-
Flexible Ichimoku parameters allow tracking price changes across different timeframes.
-
Ichimoku cloud has strong capabilities in determining major trend direction, avoiding random trades.
-
Crossover system is simple and clear, easy to interpret and automate trades.
-
Combines two indicators for multi-timeframe assessment without generating false signals.
-
Simple, aggressive strategy suitable for capitalizing on mid-term pullback opportunities for higher gains.
Risks
The main risks of this strategy are:
-
Ichimoku parameters are sensitive, improper settings across timeframes lead to bad signals.
-
Some degree of random trading risk as mid-term signals may deviate from major trend.
-
Limitations in entry timing with just two indicators.
-
Chasing momentum trades can lead to capital loss.
-
Potential for over-optimization across different instruments.
Enhancement Opportunities
The strategy can be enhanced via:
-
Testing different Ichimoku parameter combinations for optimal settings.
-
Adding filters like MACD, RSI to improve robustness.
-
Incorporating stop loss techniques like trend line, trailing stops to control risk.
-
Optimizing position sizing based on market volatility.
-
Robustness testing across instruments to prevent overfitting.
-
Using machine learning for dynamic auto-optimization.
Conclusion
This strategy effectively combines Ichimoku Kinko Hyo and crossover systems for mid-term trend tracking. The approach is simple and clear for practical application. Careful parameter optimization, position sizing and risk control can reduce trading risks. Overall, it demonstrates strong profit potential worth experimenting with and refining further.
- 1