Trend Following Short-term Trading Strategy

Overview
This strategy is a short-term trading strategy that identifies trend based on multiple indicators. It combines 8 indicators including WOW, BMA, BarColor, SuperTrend, DI, TTS, RSI and WTO to determine the trend direction and make trading decisions accordingly.
Strategy Logic
The strategy first calculates and judges the trend direction of the 8 indicators - WOW, BMA, BarColor, SuperTrend, DI, TTS, RSI and WTO.
The WOW indicator judges bullish or bearish trend based on the body location. Body near upper band indicates bullish while body near lower band indicates bearish.
The BMA indicator judges trend by the relationship between SMA of open and close. Close SMA crossing above Open SMA indicates bullish while crossing below indicates bearish.
The BarColor indicator judges trend by the color of candlesticks. Continuous yellow candles suggest bullish while black candles suggest bearish.
The SuperTrend indicator judges trend based on the price location versus the average range. Price above upper band indicates bullish while price below lower band indicates bearish.
The DI indicator judges trend by the relationship between positive and negative directional movement. Positive DI greater than Negative DI suggests bullish while vice versa suggests bearish.
The TTS indicator judges trend based on the price location versus moving average.
The RSI indicator judges trend direction based on the level of relative strength index.
The WTO indicator judges trend direction based on the wave trend oscillator.
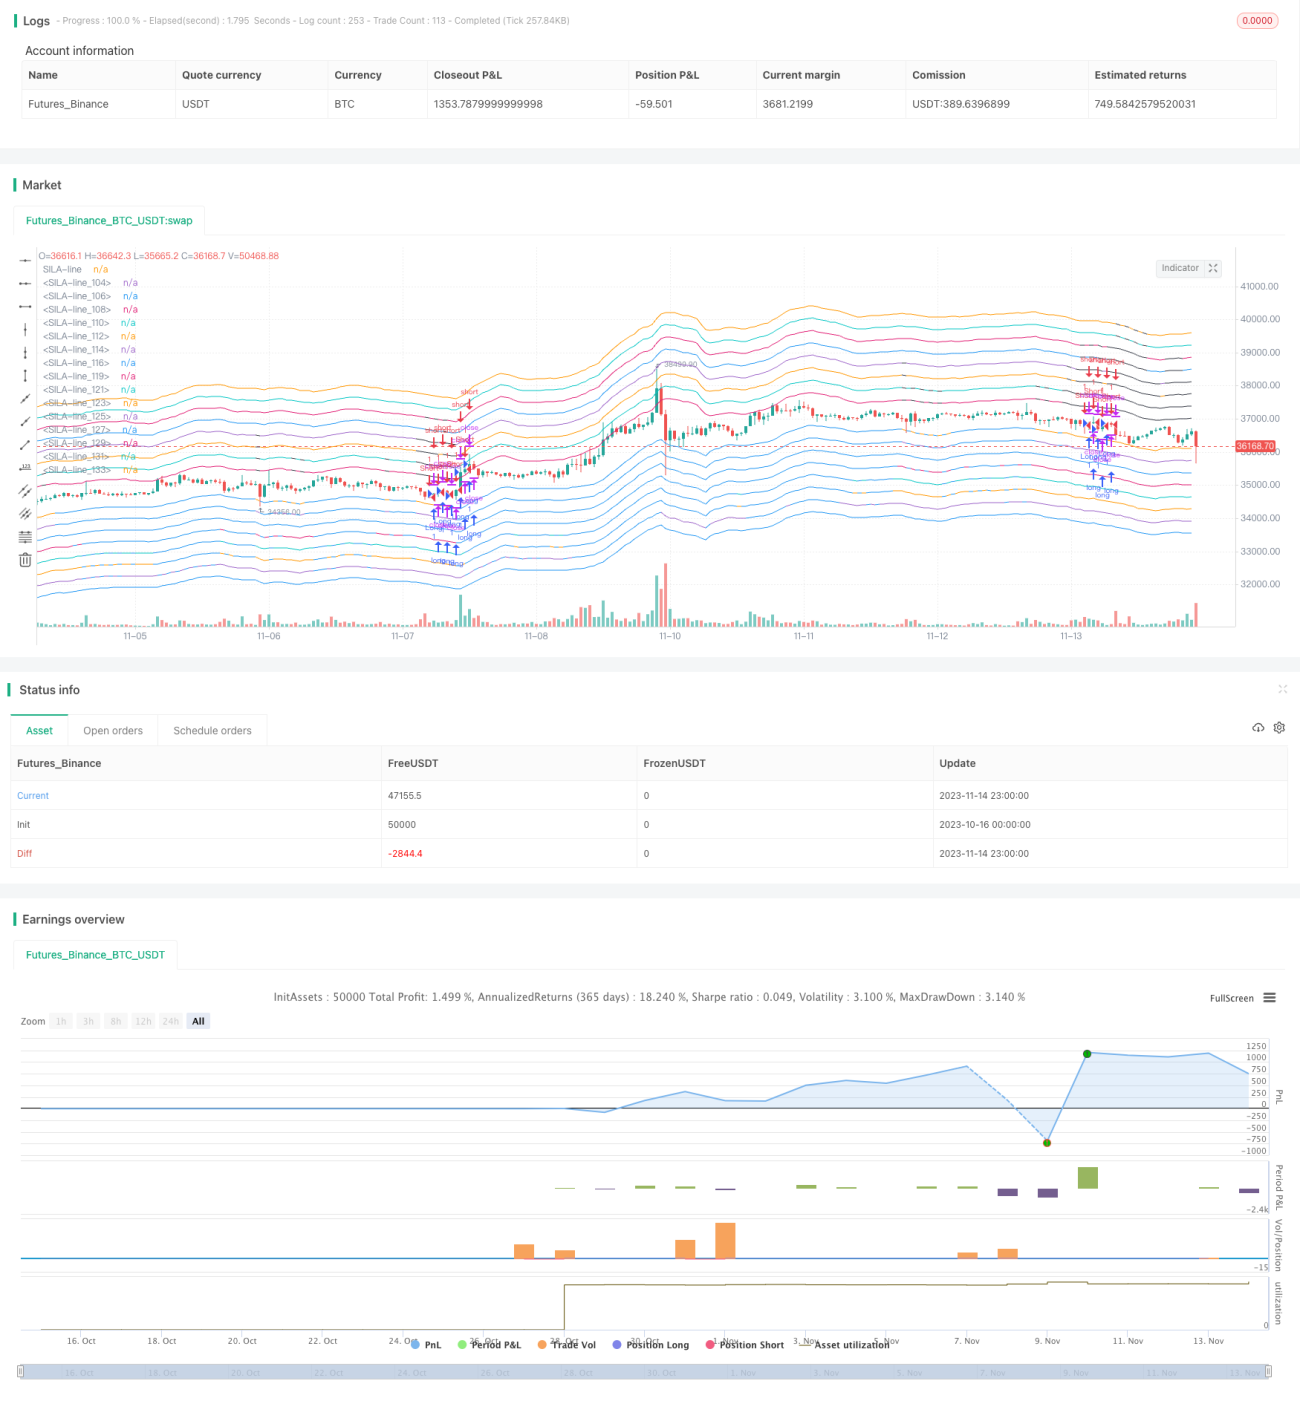
The strategy then counts the number of bullish signals from the 8 indicators and plots the SILA support and resistance lines accordingly. More lines indicate stronger trend signal.
When multiple indicators suggest bullish, buying signal is generated when close is above the lowest support line. When multiple indicators suggest bearish, selling signal is generated when close is below the lowest resistance line.
In addition, the strategy also utilizes candlestick patterns to find pullback opportunities and improve entry points.
Advantages of the Strategy
- Combining multiple indicators improves accuracy
The strategy uses 8 common trend indicators to determine the trend from multiple aspects, thus improving the accuracy and reliability of trend judgment.
- SILA system identifies strength of signals
The SILA support/resistance lines reflect the number of bullish/bearish signals. More lines indicate stronger signals. This helps traders to further evaluate the strength of trading signals.
- Candlestick patterns improve entry points
The strategy seeks pullback opportunities based on candlestick patterns to find better entry points when trend reverses.
Risks of the Strategy
- Potential conflicts between indicators
The multiple indicators may sometimes generate conflicting signals, making decision-making more difficult.
- Parameters may require optimization
The default parameters may not be optimal. Further optimization may be needed to achieve the best results.
- Consider systemic risks
Black swan events may invalidate normal technical signals. Market systemic risks should be evaluated.
- Drawdown risk
Following the trend may result in larger drawdowns during market corrections. Trade size should be managed to limit drawdown.
Enhancement of the Strategy
- Optimize indicator parameters
Systematically test and optimize parameters like period and value levels to find the optimal parameter combination.
- Add stop loss methods
Consider adding moving or percentage stop loss to control drawdowns.
- Incorporate volume indicators
Combine trend indicators with volume indicators like MAVP and OBV to improve tactic decisions.
- Manage position sizing
Research optimal position sizes for different market stages, and size up when trend becomes more apparent.
Conclusion
In summary, this is a multi-indicator trend following short-term trading strategy. It determines trend direction using multiple indicators and identifies strength of signals with the SILA system, supplemented by candlestick patterns for entry improvements. The strategy can improve accuracy but the risk of conflicting signals should be noted. Further improvements can be made through parameter optimization, stop loss optimization, volume incorporation etc.
- 1