Momentum Indicator Strategy

Overview
This strategy uses moving averages and the MACD indicator to identify price trends and momentum, combined with crossover signals to make trading decisions. It is a typical trend following strategy.
Strategy Logic
This strategy uses a double moving average crossover to generate signals. The fast moving average has a length of 12 days, while the slow moving average has a length of 26 days. When the fast MA crosses above the slow MA, a golden cross is formed which gives a long signal. When the fast MA crosses below the slow MA, a death cross is formed which gives a short signal.
At the same time, this strategy uses the MACD indicator to gauge momentum. The MACD is calculated by subtracting the slow MA (26-day EMA) from the fast MA (12-day EMA), and then smoothed by a signal line (9-day EMA). When the MACD crosses above the signal line, it indicates increasing bullish momentum. When it crosses below the signal line, it indicates increasing bearish momentum.
This strategy considers both the moving average crossover signals and the MACD indicator signals to make trading decisions. It goes long when a golden cross and a MACD crossover appear, and goes short when a death cross and MACD crossover happen.
Advantage Analysis
-
Using double moving averages combined with MACD considers both price trend and momentum, avoiding missed trading opportunities.
-
The fast and slow moving average lengths are reasonably set to identify medium-term trends. The MACD parameters are also standard for reliably detecting momentum shifts.
-
The graphical visualization of the indicators makes trading signals clear and intuitive. Trend direction and momentum strength can be judged directly.
-
The strategy parameters are flexible for optimization. The MA lengths and MACD parameters can be adjusted for different market environments.
-
It implements trend following and can profit from sustained directional trends.
Risk Analysis
-
The double moving average crossover may lag, delaying entry signals.
-
MACD can give frequent false signals, needing price confirmation.
-
Death crosses in uptrends may signal corrections, existing longs should not be exited prematurely.
-
Golden crosses in downtrends may signal rebounds, existing shorts should not be covered prematurely.
-
Strict money management should be followed, limiting position sizing to control risk.
Optimization Directions
-
Optimize MA parameters by testing different period combinations to improve crossover reliability.
-
Optimize MACD parameters by adjusting short and long EMAs and signal line to reduce false signals.
-
Add other indicators like KDJ, BOLL for confluence to improve signal accuracy.
-
Incorporate volume indicators to avoid false breakouts.
-
Backtest to find optimal parameter combinations based on historical data.
-
Implement stop loss strategies to strictly limit loss per trade and reduce risk.
Summary
This strategy integrates double moving average crossover and MACD for trend trading. Optimizing parameters and following prudent money management will help achieve steady gains long-term. But false signals need to be avoided by confirming with price action. Further optimizations can improve strategy performance.
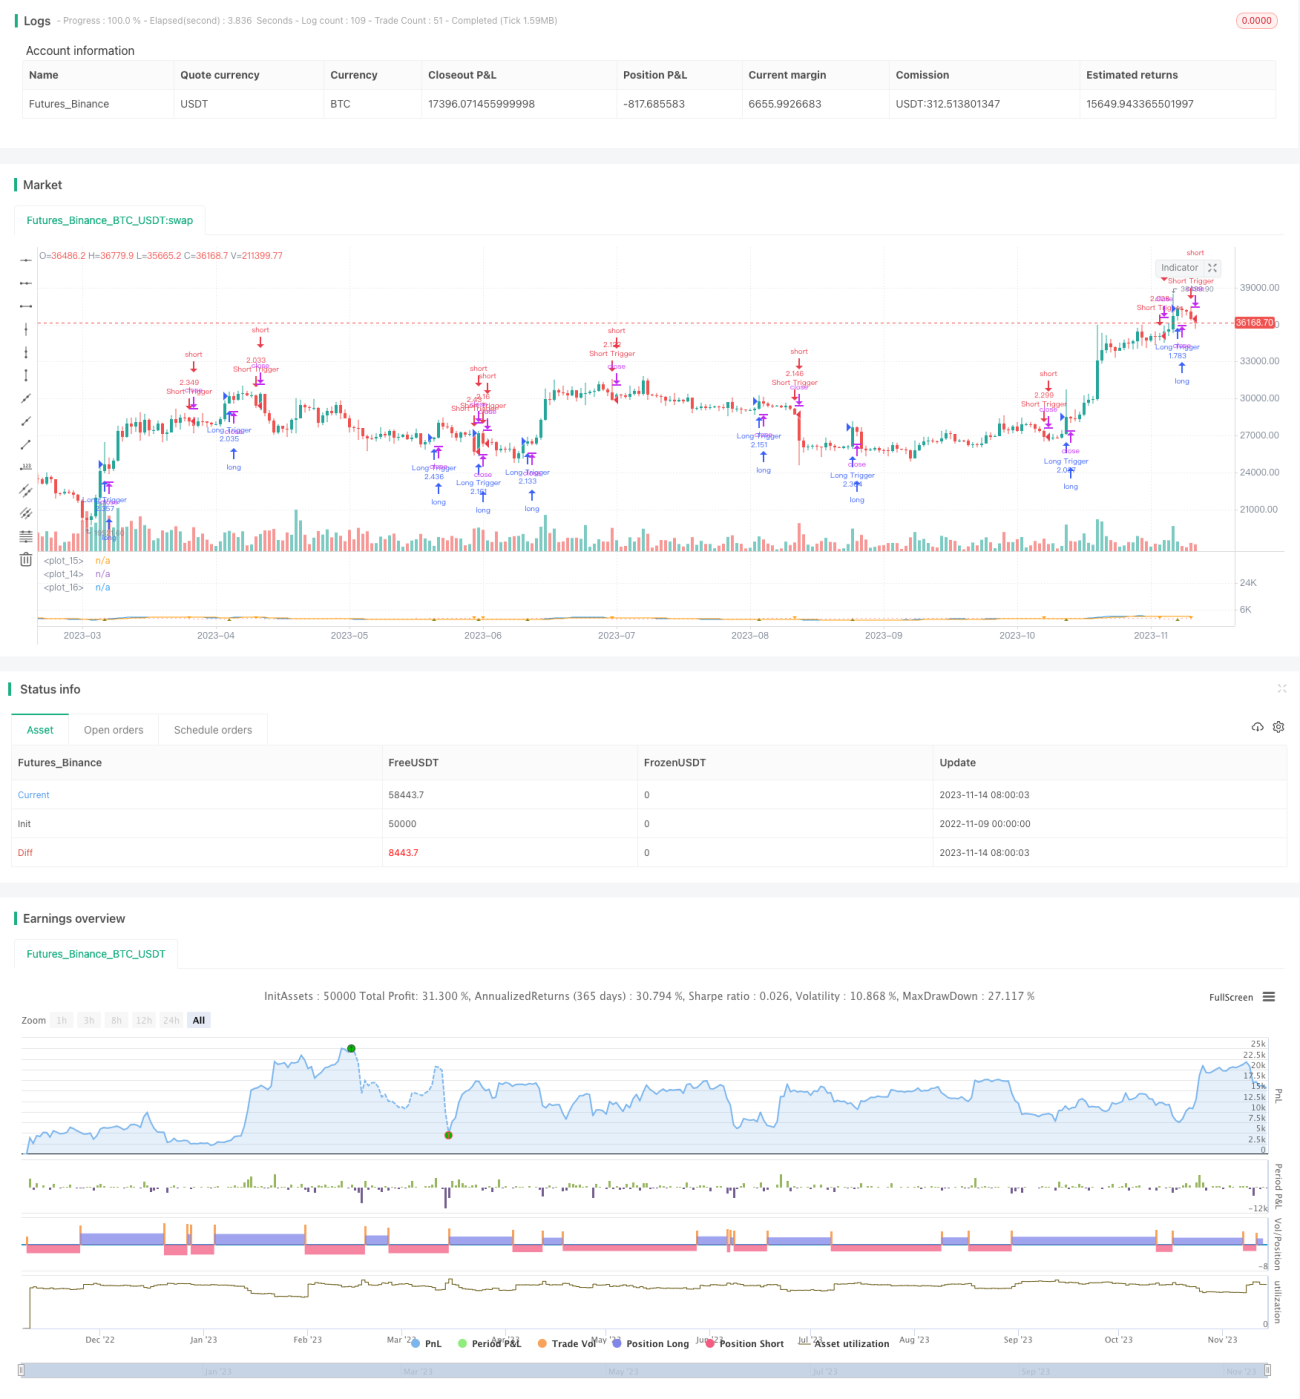
/*backtest
start: 2022-11-09 00:00:00
end: 2023-11-15 00:00:00
period: 1d
basePeriod: 1h
exchanges: [{"eid":"Futures_Binance","currency":"BTC_USDT"}]
*/

//@version=3
strategy(title="Moving Average Convergence/Divergence MaCD Backesting", shorttitle="MACD Backtesting", precision = 6, pyramiding = 3, default_qty_type = strategy.percent_of_equity, currency = currency.USD, commission_type = strategy.commission.percent, commission_value = 0.10, initial_capital = 1000, default_qty_value = 100)
source = close
fastLength = input(12, minval=1), slowLength=input(26,minval=1)- 1