Dual Strong Trend Tracking Stop Loss Strategy

Author: ChaoZhang, Date: 2023-11-16 15:50:54
Tags:

img

Overview

This strategy is designed with dual trend tracking mechanisms based on Supertrend and Relative Strength Index to accurately determine the trend of the market and set reasonable stop loss and take profit points. The strategy features stop loss points that track the market movement, take profit points based on the trend, and dual trend judgment, which can effectively control the risk of individual trades and achieve super strong returns in trending markets.

Strategy Logic

  1. Calculate the Supertrend to determine the main trend direction. Supertrend can accurately judge the trend direction and give ideal entry points.

  2. Calculate the Relative Strength Index (RSI) as an auxiliary indicator for trend judgment. High RSI indicates a bullish trend in a bull market. Low RSI indicates a bearish trend in a bear market.

  3. Go long when the close price crosses above the Supertrend line, and go short when the close price breaks below the Supertrend line.

  4. Reasonably set stop loss and take profit points. When going long, set the Supertrend line as the stop loss, and the Supertrend line plus reasonable profit as the take profit. When going short, set the Supertrend line as the stop loss, and the Supertrend line minus reasonable profit as the take profit.

  5. The stop loss points will float according to the market fluctuation. As the market moves in a favorable direction, the stop loss line will move towards the favorable direction to secure profits.

  6. Only enter trades when RSI aligns with Supertrend, indicating a stronger current trend. Avoid entering when RSI diverges from Supertrend, indicating a potential trend reversal.

Advantage Analysis

  • The dual trend judgment mechanism can reduce false signals and enhance the stability of the strategy.

  • The stop loss points move with the trend to maximize profit locking and avoid premature stop loss.

  • The application of RSI filters out some weak trading signals.

  • Reasonable take profit positioning maximizes profits.

  • Adjustable strategy parameters can be optimized for different products and market conditions.

  • Controllable drawdowns give the strategy strong risk management capabilities.

Risk Analysis

  • In case of black swan events like significant policy news, huge market swings may stop out positions and cause major losses. Wider stop loss points or timely position exiting prior to events can help manage such risks.

  • Improper parameter settings may lead to unreasonable stop loss and take profit points, enlarging losses or shrinking profits. Repeated backtests can help find the optimal parameter combination.

  • Divergence between RSI and Supertrend may generate false signals during range-bound markets. Avoid trading and wait for a clear trend in such cases.

Optimization Directions

  • Optimize the ATR period parameter for different products.

  • Optimize RSI settings to find more stable auxiliary trend conditions.

  • Incorporate other indicators like Bollinger Bands and KDJ to set more precise entry and exit rules.

  • Test different take profit strategies like trailing stop, staggered profit taking, wick stop etc. to improve profitability.

  • Adjust position sizing based on backtest results to lower single trade risks.

Conclusion

The strategy demonstrates overall strong stability and profitability. The dual trend judgment filters out noise effectively and the stop loss/profit taking strategy locks in profits and controls risks. Continuous optimization of parameters and entry/exit conditions will enable great performance across different market environments. It can serve as an excellent template strategy for quantitative trading and is worth in-depth research and application.
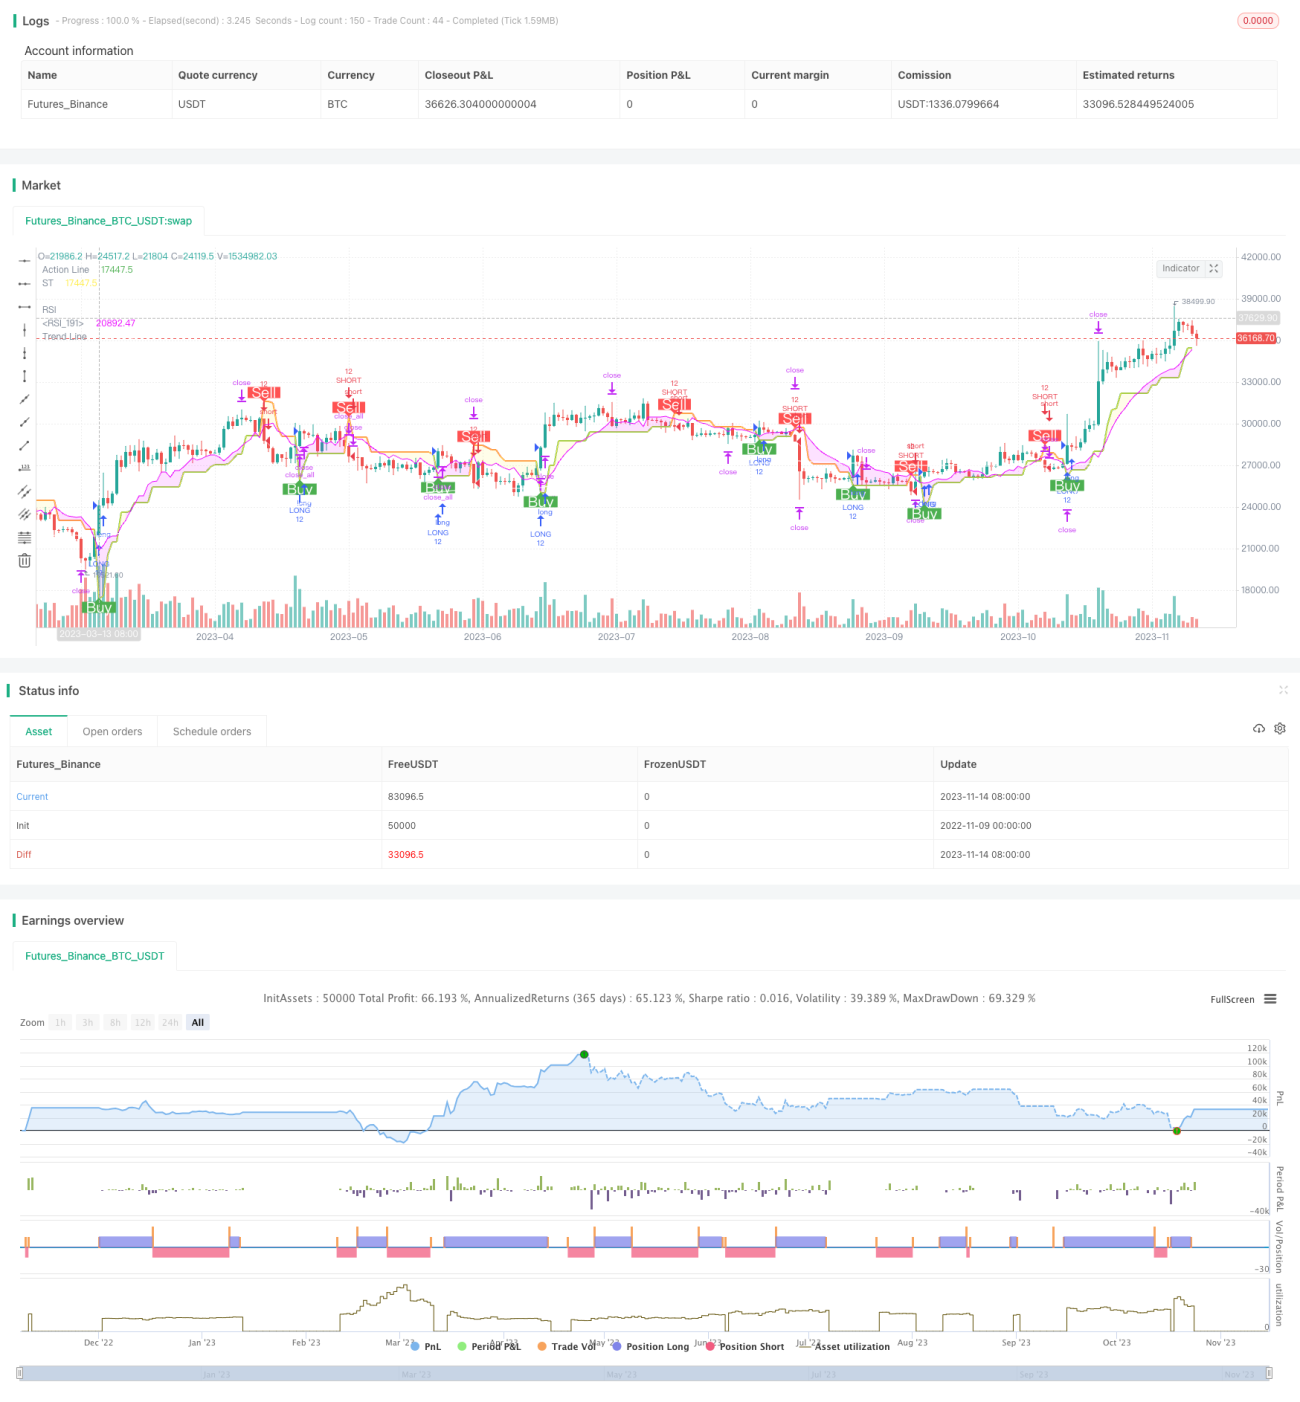

/*backtest
start: 2022-11-09 00:00:00
end: 2023-11-15 00:00:00
period: 1d
basePeriod: 1h
exchanges: [{"eid":"Futures_Binance","currency":"BTC_USDT"}]
*/

//@version=5
//
// ▒▒▒▒▒▒▒▒▒▒▒▒▒▒▒▒▒▒▒▒▒▒▒▒▒▒▒▒▒▒▒▒▒▒▒▒▒▒▒▒▒▒▒▒▒▒▒▒▒▒▒▒▒▒▒▒▒▒▒▒▒▒▒▒▒▒▒▒▒▒▒▒▒▒▒▒▒▒▒▒▒▒▒▒▒▒▒▒▒▒▒▒▒▒▒▒▒▒▒▒▒▒▒▒▒▒▒▒▒▒▒▒▒▒ 
//  -----------------------------------------------------------------------------
//  Copyright 2019 Mauricio Pimenta | exit490
//  SuperTrend with Trailing Stop Loss script may be freely distributed under the MIT license.
//
//  Permission is hereby granted, free of charge, 
//  to any person obtaining a copy of this software and associated documentation files (the "Software"), 
//  to deal in the Software without restriction, including without limitation the rights to use, copy, modify, merge, 
//  publish, distribute, sublicense, and/or sell copies of the Software, and to permit persons to whom the Software is furnished to do so, 
//  subject to the following conditions:
//
//  The above copyright notice and this permission notice shall be included in all copies or substantial portions of the Software.
//
//  THE SOFTWARE IS PROVIDED "AS IS", WITHOUT WARRANTY OF ANY KIND, 
//  EXPRESS OR IMPLIED, INCLUDING BUT NOT LIMITED TO THE WARRANTIES OF MERCHANTABILITY, 
//  FITNESS FOR A PARTICULAR PURPOSE AND NONINFRINGEMENT. IN NO EVENT SHALL THE AUTHORS OR COPYRIGHT HOLDERS BE LIABLE FOR ANY CLAIM, 
//  DAMAGES OR OTHER LIABILITY, WHETHER IN AN ACTION OF CONTRACT, TORT OR OTHERWISE, ARISING FROM, 
//  OUT OF OR IN CONNECTION WITH THE SOFTWARE OR THE USE OR OTHER DEALINGS IN THE SOFTWARE.
//
//  -----------------------------------------------------------------------------
//
//  Authors:  @exit490
//  Revision: v1.0.0
//  Date:     5-Aug-2019
//
//  Description
//  ===========
//  SuperTrend is a moving stop and reversal line based on the volatility (ATR).
//  The strategy will ride up your stop loss when price moviment 1%.
//  The strategy will close your operation when the market price crossed the stop loss.
//  The strategy will close operation when the line based on the volatility will crossed
//
//  The strategy has the following parameters:
//
//  INITIAL STOP LOSS - Where can isert the value to first stop.
//  POSITION TYPE - Where can to select trade position.
//  ATR PERIOD - To select number of bars back to execute calculation
//  ATR MULTPLIER - To add a multplier factor on volatility
//  BACKTEST PERIOD - To select range.
//  
//  -----------------------------------------------------------------------------
//  Disclaimer:
//    1. I am not licensed financial advisors or broker dealers. I do not tell you 
//       when or what to buy or sell. I developed this software which enables you 
//       execute manual or automated trades multplierFactoriplierFactoriple trades using TradingView. The 
//       software allows you to set the criteria you want for entering and exiting 
//       trades.
//    2. Do not trade with money you cannot afford to lose.
//    3. I do not guarantee consistent profits or that anyone can make money with no 
//       effort. And I am not selling the holy grail.
//    4. Every system can have winning and losing streaks.
//    5. Money management plays a large role in the results of your trading. For 
//       example: lot size, account size, broker leverage, and broker margin call 
//       rules all have an effect on results. Also, your Take Profit and Stop Loss 
//       settings for individual pair trades and for overall account equity have a 
//       major impact on results. If you are new to trading and do not understand 
//       these items, then I recommend you seek education materials to further your
//       knowledge.
//
//    YOU NEED TO FIND AND USE THE TRADING SYSTEM THAT WORKS BEST FOR YOU AND YOUR 
//    TRADING TOLERANCE.
//
//    I HAVE PROVIDED NOTHING MORE THAN A TOOL WITH OPTIONS FOR YOU TO TRADE WITH THIS PROGRAM ON TRADINGVIEW.
//    
//    I accept suggestions to improve the script.
//    If you encounter any problems I will be happy to share with me.
//  -----------------------------------------------------------------------------
//
// ▒▒▒▒▒▒▒▒▒▒▒▒▒▒▒▒▒▒▒▒▒▒▒▒▒▒▒▒▒▒▒▒▒▒▒▒▒▒▒▒▒▒▒▒▒▒▒▒▒▒▒▒▒▒▒▒▒▒▒▒▒▒▒▒▒▒▒▒▒▒▒▒▒▒▒▒▒▒▒▒▒▒▒▒▒▒▒▒▒▒▒▒▒▒▒▒▒▒▒▒▒▒▒▒▒▒▒▒▒▒▒▒▒▒ //

strategy(title='DEO SESSSION', shorttitle='DEO S', overlay=true, precision=8, calc_on_order_fills=true, calc_on_every_tick=true, backtest_fill_limits_assumption=0, default_qty_type=strategy.percent_of_equity, default_qty_value=100, initial_capital=1000, currency=currency.USD, linktoseries=true)

//
// ▒▒▒▒▒▒▒▒▒▒▒▒▒▒▒▒▒▒▒▒▒▒▒▒▒▒▒▒▒▒▒▒▒▒▒▒▒▒▒▒▒▒▒▒▒▒▒▒▒▒▒▒▒▒▒▒▒▒▒▒▒▒▒▒▒▒▒▒▒▒▒▒▒▒▒▒▒▒▒▒▒▒▒▒▒▒▒▒▒▒▒▒▒▒▒▒▒▒▒▒▒▒▒▒▒▒▒▒▒▒▒▒▒▒ //

// === BACKTEST RANGE ===
backTestSectionFrom = input(title='════════════ FROM ════════════', defval=true)


// selected dates 
i_startTime     = input(title="START FILTER", defval=timestamp("02 Jan 2023 00:00 +0000"), group="RISK MANAGEMENT", tooltip="Start date & time to begin searching for setups")
i_endTime       = input(title="END FILTER", defval=timestamp("12 Dec 2100 00:00 +0000"), group="RISK MANAGEMENT", tooltip="End date & time to stop searching for setups")
afterStartDate = true

//
// ▒▒▒▒▒▒▒▒▒▒▒▒▒▒▒▒▒▒▒▒▒▒▒▒▒▒▒▒▒▒▒▒▒▒▒▒▒▒▒▒▒▒▒▒▒▒▒▒▒▒▒▒▒▒▒▒▒▒▒▒▒▒▒▒▒▒▒▒▒▒▒▒▒▒▒▒▒▒▒▒▒▒▒▒▒▒▒▒▒▒▒▒▒▒▒▒▒▒▒▒▒▒▒▒▒▒▒▒▒▒▒▒▒▒ //

parameterSection = input(title='══════════ STRATEGY ══════════', defval=true)
// === INPUT TO SELECT POSITION ===
positionType = input.string(defval='LONG', title='Position Type', options=['LONG', 'SHORT'])

// === INPUT TO SELECT INITIAL STOP LOSS
initialStopLossPercent = input.float(defval=3.0, minval=0.0, title='Initial Stop Loss')

// === INPUT TO SELECT BARS BACK
barsBack = input(title='ATR Period', defval=1)

// === INPUT TO SELECT MULTPLIER FACTOR 
multplierFactor = input.float(title='ATR multplierFactoriplier', step=0.1, defval=3.0)


RSI = input.int(title='RSI', defval=7, minval=1, maxval=100)

calcSection = input(title='══════════ LOT CALC ══════════', defval=true)
accountBalance = input.float(title="ACCOUNT BALANCE", defval=250000, minval=1,  group="INPUTS")
entryPrice = input.float(title="ENTRY PRICE", defval=100, minval=1,  group="INPUTS")
slPrice = input.float(title="STOP LOSS PRICE", defval=100, minval=1,  group="INPUTS")
riskPer = input.float(title="RISK USD", defval=1, minval=0.1,  group="INPUTS")
lotSize = input.float(title="LOT SIZE", defval=10, minval=0.1,  group="INPUTS")

RiskSize = riskPer
qtyLongTargetPrice = math.abs((RiskSize / ((entryPrice - slPrice) * syminfo.pointvalue)) / lotSize)

trendcSection = input(title='══════════ TREND LINE ══════════', defval=true)
// ema trend 
tLen = input.int(200, minval=1, title="Trend Line")
tSrc = input(close, title="Source")
thisEma = ta.ema(tSrc, tLen)
plot(thisEma, title = "Trend Line",color=#ffffff)

MTSection = input(title='══════════ MT LOGIN ══════════', defval=true)
exchange = input.string(defval='MT5', title='EXCHANGE',  options=['MT4', 'MT5'])
mtLogin= input.string(defval="", title='MT LOGIN', group = "mt")
mtPassword =input.string(defval='', title='MT PASSWORD',  group = "mt")
mtServer =input.string(defval='', title='MT SERVER', group = "mt")
mtIsOn = input.string(defval='ON', title='STRATEGY ON', options=['ON', 'OFF'])
mtEntryMode = input.string(defval='CLOSE OPEN', title='ENTRY MODE', options=['CLOSE OPEN', 'OPEN'])

displaySection = input(title='══════════ DISPLAY LOGIN ══════════', defval=true)
displayTable = input(title="DISPLAY TABLE", defval=false, group = 'PRODUCTION', tooltip = "MAKES YOUR STRATEGY TRIGGER SLOWER")


//
// ▒▒▒▒▒▒▒▒▒▒▒▒▒▒▒▒▒▒▒▒▒▒▒▒▒▒▒▒▒▒▒▒▒▒▒▒▒▒▒▒▒▒▒▒▒▒▒▒▒▒▒▒▒▒▒▒▒▒▒▒▒▒▒▒▒▒▒▒▒▒▒▒▒▒▒▒▒▒▒▒▒▒▒▒▒▒▒▒▒▒▒▒▒▒▒▒▒▒▒▒▒▒▒▒▒▒▒▒▒▒▒▒▒▒ //

// LOGIC TO FIND DIRECTION WHEN THERE IS TREND CHANGE ACCORDING VOLATILITY
atr = multplierFactor * ta.atr(barsBack)

longStop = hl2 - atr
longStopPrev = nz(longStop[1], longStop)
longStop := close[1] > longStopPrev ? math.max(longStop, longStopPrev) : longStop

shortStop = hl2 + atr
shortStopPrev = nz(shortStop[1], shortStop)
shortStop := close[1] < shortStopPrev ? math.min(shortStop, shortStopPrev) : shortStop

direction = 1
direction := nz(direction[1], direction)
direction := direction == -1 and close > shortStopPrev ? 1 : direction == 1 and close < longStopPrev ? -1 : direction


longColor = color.blue
shortColor = color.blue

var valueToPlot = 0.0
var colorToPlot = color.white

if direction == 1
    valueToPlot := longStop
    colorToPlot := color.green
    colorToPlot
else
    valueToPlot := shortStop
    colorToPlot := color.red
    colorToPlot

//RSI

src = close

ep = 2 * RSI - 1
auc = ta.ema(math.max(src - src[1], 0), ep)
adc = ta.ema(math.max(src[1] - src, 0), ep)
x1 = (RSI - 1) * (adc * 70 / (100 - 70) - auc)
ub = x1 >= 0 ? src + x1 : src + x1 * (100 - 70) / 70
x2 = (RSI - 1) * (adc * 30 / (100 - 30) - auc)
lb = x2 >= 0 ? src + x2 : src + x2 * (100 - 30) / 30

//Affichage
plot(math.avg(ub, lb), color=color.white ,linewidth=1, title='RSI')
plot(valueToPlot == 0.0 ? na : valueToPlot, title='Action Line', linewidth=2, color=color.new(colorToPlot, 0))
plotshape(direction == 1 and direction[1] == -1 ? longStop : na, title='Buy', style=shape.labelup, location=location.absolute, size=size.normal, text='Buy', textcolor=color.new(color.white, 0), color=color.new(color.green, 0))
plotshape(direction == -1 and direction[1] == 1 ? shortStop : na, title='Sell', style=shape.labeldown, location=location.absolute, size=size.normal, text='Sell', textcolor=color.new(color.white, 0), color=color.new(color.red, 0))


p_ma1 = plot(valueToPlot, title = "ST", color = color.rgb(255, 236, 66))
p_ma2 = plot(math.avg(ub, lb), title = "RSI", color = color.rgb(234, 0, 255))
// Definitions: Trends
TrendUp1() =>
    valueToPlot > math.avg(ub, lb)
TrendDown1() =>
    valueToPlot < math.avg(ub, lb)

trendColor1 = TrendUp1() ? color.rgb(255, 236, 66, 85): TrendDown1() ? color.rgb(234, 0, 255, 85) : color.rgb(255, 255, 255, 85)
fill(p_ma1, p_ma2, color=trendColor1)


longCondition () =>
    ta.crossover(close, valueToPlot)

shortCondition () =>
    ta.crossunder(close, valueToPlot)

IsLongShort() =>
    strategy.position_size != 0

getNewLotSize() => 
    math.abs(riskPer / (close - valueToPlot))

// plot(getNewLotSize(), "new lot size")
newLotS = getNewLotSize()


alertManagement = str.tostring(exchange) + "," + str.tostring(mtLogin) +  "," +str.tostring(mtPassword) + "," 
alertManagement += str.tostring(mtServer) + "," + str.tostring(newLotS)
// alertManagement += str.tostring(stopLoss) + "," + str.tostring(applyingSL) + "," + str.tostring(applyTrailingStop)  + "," 
// alertManagement += str.tostring(exchange) + "," + str.tostring(exchangeAccount) + "," + str.tostring(slAmount)  + "," + str.tostring(closeTpAmount) + "," 
// alertManagement += str.tostring(exchangeLeverage) + "," + str.tostring(exchangeLeverageType) + "," 
// alertManagement += str.tostring(mtLogin) + "," + str.tostring(mtPassword) + "," + str.tostring(mtServer)  + "," + str.tostring(mtLot) + "," 
// alertManagement += str.tostring(mtTp) + "," + str.tostring(mtTs) + "," + str.tostring(orderStrategy) 


// alertManagement = "alertManagement"
myStop = 0.0
myTarget = 0.0

if (longCondition())
    qtyLongTargetPrice := math.abs((RiskSize / ((close - valueToPlot) * syminfo.pointvalue)) / lotSize)
    if IsLongShort()
        strategy.close_all(comment = "close all entries")
    strategy.entry("LONG", strategy.long, qty=12, comment="LONG", alert_message=alertManagement)
    strategy.exit("TPL", "LONG", stop=valueToPlot, limit= close + (close - valueToPlot), comment="Target", alert_message=alertManagement)

if (shortCondition())
    qtyLongTargetPrice := math.abs((RiskSize / ((close - valueToPlot) * syminfo.pointvalue)) / lotSize)
    if IsLongShort()
        strategy.close_all(comment = "close all entries")
    strategy.entry("SHORT", strategy.short, qty=12, comment="SHORT", alert_message=alertManagement)
    strategy.exit("TPS", "SHORT", stop=valueToPlot, limit= close + (close - valueToPlot), comment="Target", alert_message=alertManagement)


// Calculate the average profit per open trade
// avgProfit = profitSum / strategy.opentrades

getTotalProfit()=>
    // Sum the profit of all open trades
    profitSum = 0.0
    for tradeNumber = 0 to strategy.closedtrades - 1
        if strategy.closedtrades.profit(tradeNumber) > 0
            profitSum += strategy.closedtrades.profit(tradeNumber)
    result = profitSum

getTotalLoss()=>
    // Sum the profit of all open trades
    lossSum = 0.0
    for tradeNumber = 0 to strategy.closedtrades - 1
        if strategy.closedtrades.profit(tradeNumber) < 0
            lossSum += strategy.closedtrades.profit(tradeNumber)
    result = lossSum


maxLossRun()=>
    lossRun = 0.0
    currentMaxLoss = 0.0
    for tradeNo = 0 to strategy.closedtrades - 1
        if strategy.closedtrades.profit(tradeNo) < 0.0
            lossRun += strategy.closedtrades.profit(tradeNo)
        else 
            currentMaxLoss := math.min(currentMaxLoss, lossRun)  
            lossRun := 0.0
    result = currentMaxLoss


TotalTrades() =>
	strategy.closedtrades + strategy.opentrades

maxDrawDown() =>
    maxDrawdown = 0.0
    for tradeNo = 0 to strategy.closedtrades - 1
        maxDrawdown := math.max(maxDrawdown, strategy.closedtrades.max_drawdown(tradeNo))
    result = maxDrawdown

maxRunUp() =>
    maxRunup = 0.0
    for tradeNo = 0 to strategy.closedtrades - 1
        maxRunup := math.max(maxRunup, strategy.closedtrades.max_runup(tradeNo))
    result = maxRunup

tradeMaxLossReached() =>
    maxLoss = 0.0
    for tradeNo = 0 to strategy.closedtrades - 1
        maxLoss := math.min(maxLoss, strategy.closedtrades.profit(tradeNo))
    result = maxLoss


tradingStartTime() =>
    strategy.closedtrades.entry_time(0)


daysBetween(t1, t2) => (t1 - t2) / 86400000

// Table
var InfoPanel = table.new(position = position.bottom_right, columns = 2, rows = 40, border_width = 1)
ftable(_table_id, _column, _row, _text, _bgcolor) => 
    table.cell(_table_id, _column, _row, _text, 0, 0, color.black, text.align_right, text.align_center, size.small, _bgcolor)

tfString(int timeInMs) =>
    // @function    Produces a string corresponding to the input time in days, hours, and minutes.
    // @param       (series int) A time value in milliseconds to be converted to a string variable. 
    // @returns     (string) A string variable reflecting the amount of time from the input time.
    float s  = timeInMs / 100000
    float m  = s / 60
    float h  = m / 60
    float d  = h / 24
    float mo = d / 30.416
    int tm   = math.floor(m % 60)
    int tr   = math.floor(h % 24)
    int td   = math.floor(d % 30.416)
    int tmo  = math.floor(mo % 12)
    int ys   = math.floor(d / 365)
    
    string result = 
      switch
        d == 30 and tr == 10 and tm == 30 => "1M"
        d == 7  and tr == 0  and tm == 0  => "1W"
        =>
            string yStr  = ys  ? str.tostring(ys)  + "Y "  : ""
            string moStr = tmo ? str.tostring(tmo) + "M "  : ""
            string dStr  = td  ? str.tostring(td)  + "D "  : ""
            string hStr  = tr  ? str.tostring(tr)  + "H "  : ""
            string mStr  = tm  ? str.tostring(tm)  + "min" : ""
            yStr + moStr + dStr + hStr + mStr


if displayTable
    maxLossRunInMarket= maxLossRun()
    maxLossReached = tradeMaxLossReached()
    tradeMaxLossReached = tradeMaxLossReached()
    tradingInDays=daysBetween(time, tradingStartTime())
    totalTrades=TotalTrades()

More