概述
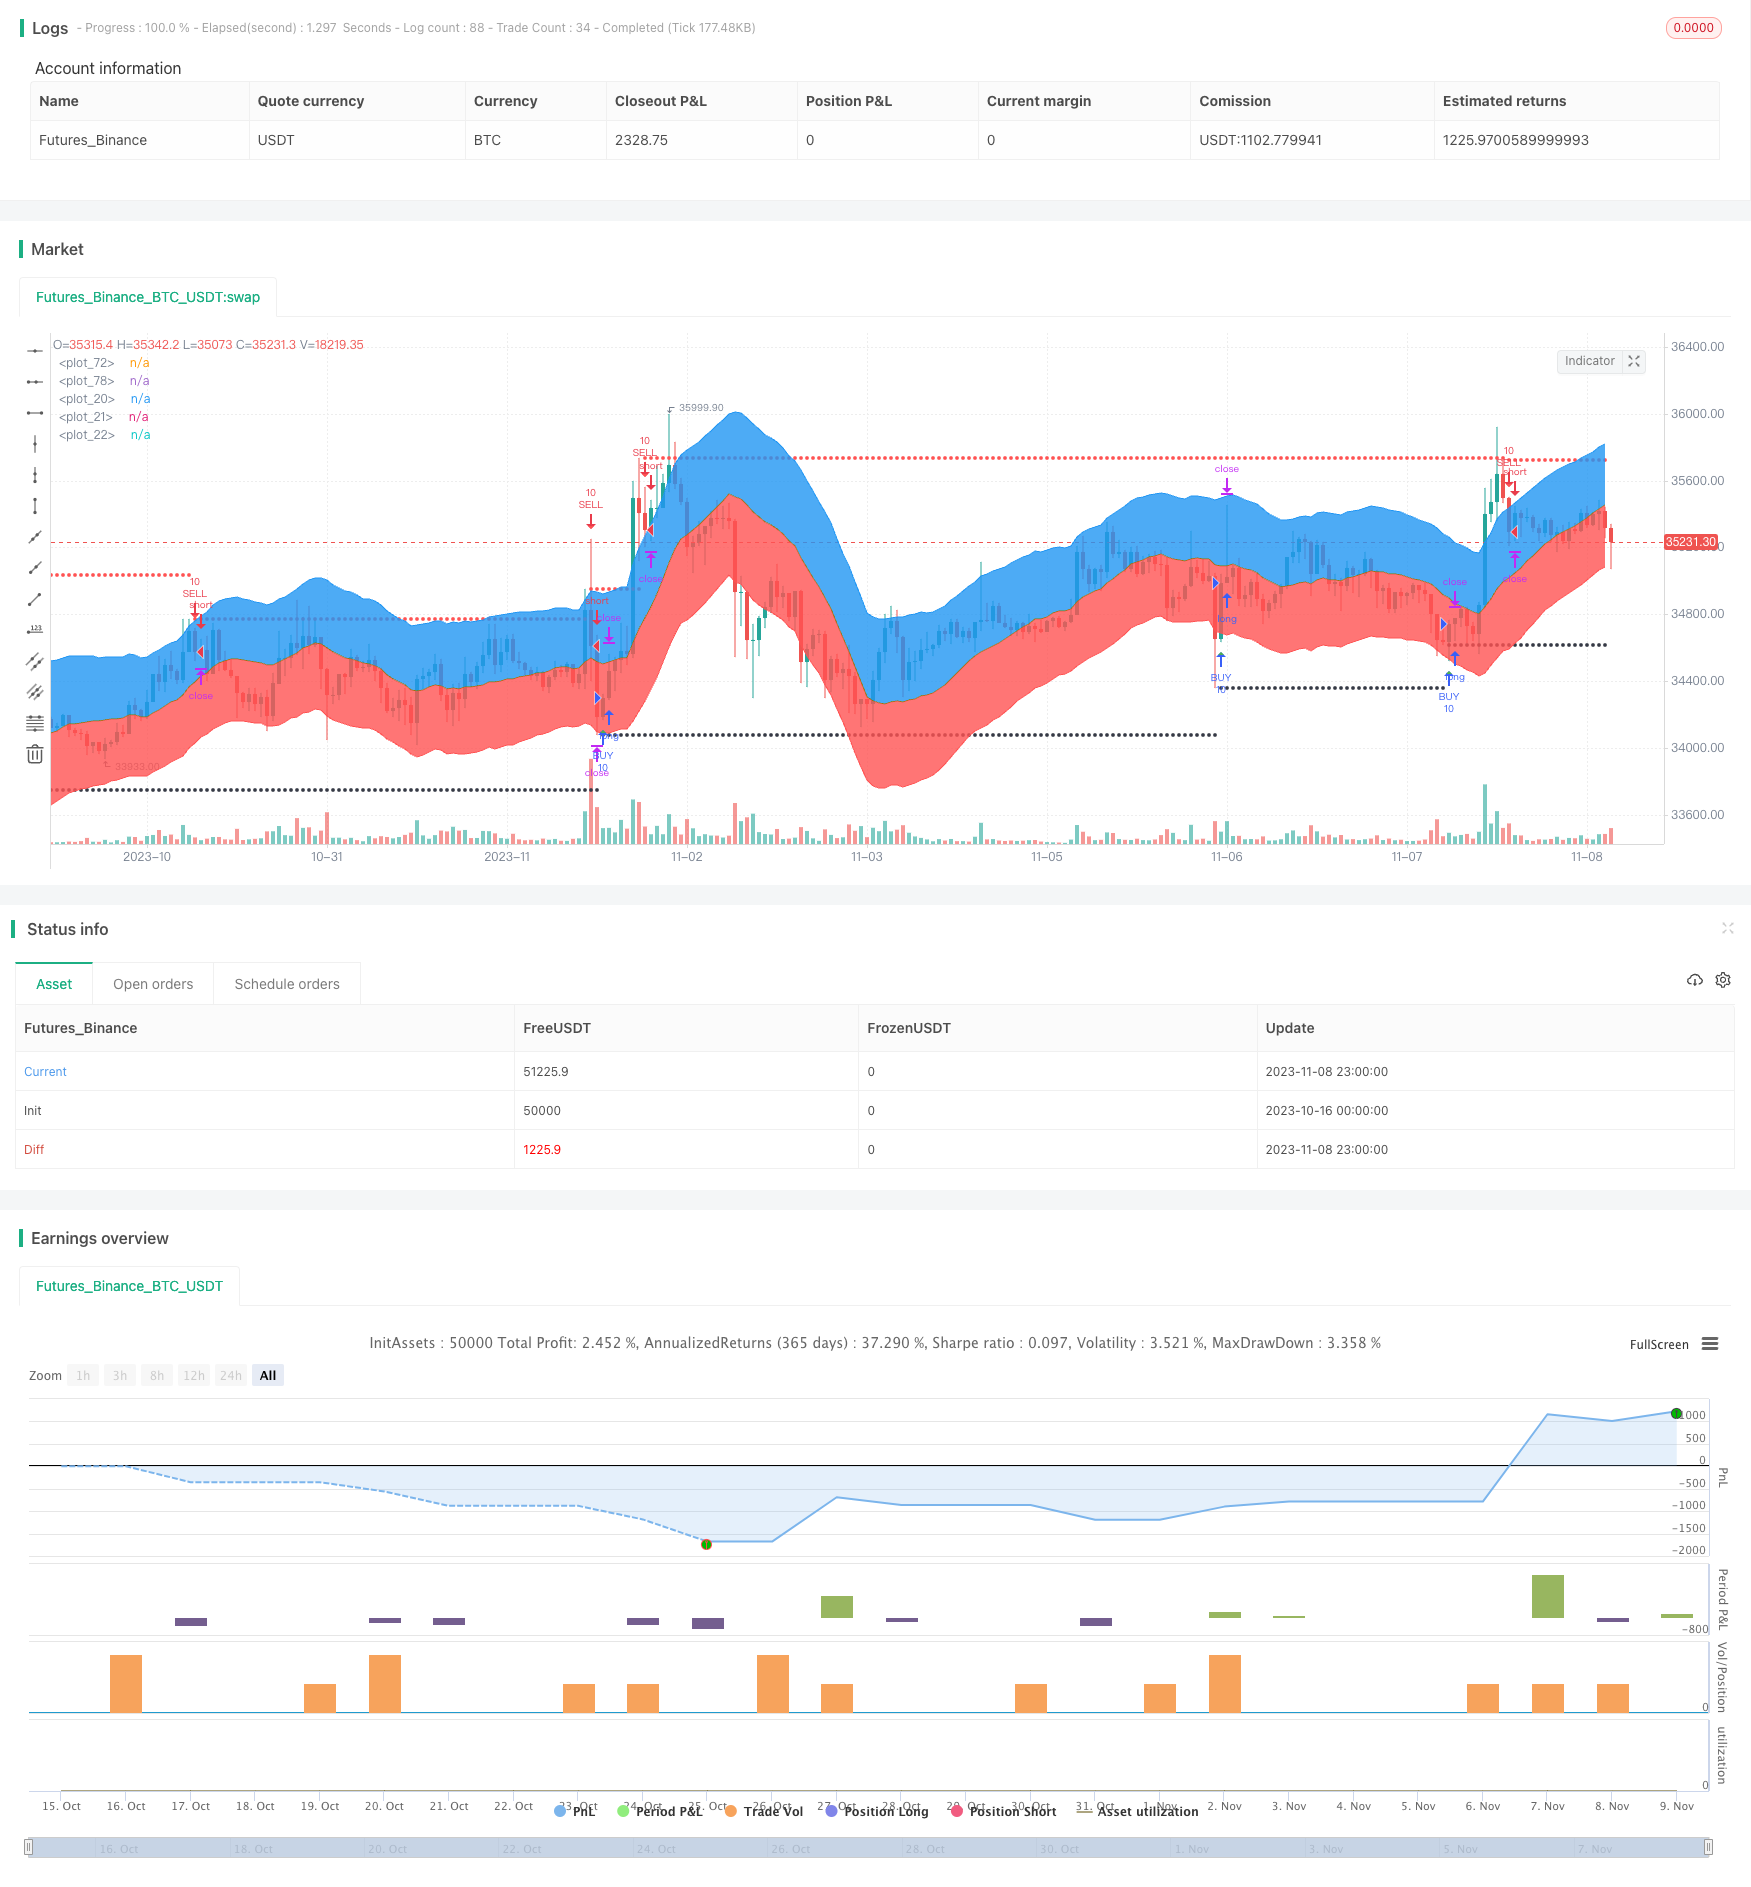
该策略基于布林通道指标,结合自适应移动均线,实现对趋势的精准判断和跟踪。通过动态调整参数,使策略能够适应不同品种和市场环境,具有较强的稳定性和适应性。
策略原理
该策略主要由如下几部分组成:
计算自适应移动均线。这里使用线性回归指标计算一定周期内的线性回归曲线作为移动均线。
计算布林通道上下轨。这里使用自适应ATR指标计算通道带,再结合用户指定的参数ratio2,计算出布林通道的上下轨。
判断买入卖出时机。根据价格是否突破布林通道上下轨来判断趋势方向和买入卖出时机。当价格从下向上突破下轨时视为买入信号;当价格从上向下跌破上轨时则为卖出信号。
设置止损停利。采用固定点数止损以控制 risk,同时采用先固定点数后追踪止损方式设置止盈,在保证利润的同时争取趋势的最大化。
结合回测期设置了回测起止时间,对策略进行测试优化。
策略优势
自适应参数设计。布林通道的通道带和移动均线均采用自适应方式计算,使策略能够适应市场的变化。
突破判断清晰。使用布林通道上下轨突破来判断趋势转折点, biosignal 比较清晰。
止损止盈设置合理。采用固定止损控制风险,追踪止盈方式争取趋势利润最大化。
回测验证有效性。设置回测时间对策略进行验证,确保其在历史行情中也具有效果。
容易理解实现。该策略思路清晰易懂,代码也比较简洁,易于理解和实盘操作。
策略风险
布林通道需要参数优化。布林通道的通道带和回归周期需要根据不同品种和市场环境进行优化,如果优化不当则会出现多次错失信号或者频繁 False Triggers。
回测时间可能不够充分。该回测仅设置了近期的回测范围,无法覆盖更长历史行情来全面验证策略稳定性。
可能存在过拟合风险。当前回测参数可能只针对最近特定行情进行了优化,从而存在对历史过度拟合的风险。
止损点数需要评估确定。当前的止损点数较小,可能会过于灵敏而被小震荡止损割损。需要评估合适的止损点数。
缺乏量化验证指标。当前仅从图形突破判断交易信号,没有引入数量化指标来验证信号有效性。
策略优化方向
引入更多自适应指标。可以测试各种自适应均线,自适应通道指标的组合,构建更具鲁棒性的趋势跟踪策略。
优化参数设置。可以通过更系统的方法如遗传算法等找到布林通道和均线参数的最优组合。
扩大回测时间范围。扩大回测时间范围,检验参数优化的稳健性。引入滑点、手续费等交易成本进行更真实的回测。
引入量化过滤规则。设定如交易量突破、MACD柱差距等量化指标规则,避免出现错误的布林通道突破信号。
优化止损机制。评估不同的固定止损点数设置以及不同的追踪止损方式,找到最优的止损模式。
6.实盘验证。在实盘中运行优化后的策略,记录收益回撤情况,进一步完善策略的稳定可靠性。
总结
该策略整体思路清晰,使用布林通道判定趋势方向和捕捉突破信号,并辅以移动均线确定整体趋势方向。通过一定的优化,可以成为一个较为稳定可靠的趋势跟踪策略。但仍需注意回测时间范围的代表性,引入量化过滤规则以及止损水平的把握。如果能够处理好这些问题,该策略可以在实战中获得稳定且可观的收益。
/*backtest
start: 2023-10-16 00:00:00
end: 2023-11-09 00:00:00
period: 1h
basePeriod: 15m
exchanges: [{"eid":"Futures_Binance","currency":"BTC_USDT"}]
*/

//@version=4
strategy("Linear Regression (Backtest / Trailing Stop)",overlay=true)
close_price = close[0]

len = input(40)
linear_reg = linreg(close_price, len, 0)

calculationToPlotAverageMeanLine=linear_reg
useUpperDeviation = input(true, "Upper Deviation", bool)
useLowerDeviation = input(true, "Lower Deviation", bool)
ratio2=input(defval=2,title=" Ratio 2")
avg=atr(len)
r2=avg*ratio2
top=linear_reg+r2
bott=linear_reg-r2

calculationToPlotUpperLine=top
calculationToPlotLowerLine=bott

plotUpperDeviationLine = plot(not useUpperDeviation ? na : calculationToPlotUpperLine, color=color(blue,0))
plotAverageMeanLine = plot(calculationToPlotAverageMeanLine, color=color(olive,0))
plotLowererDeviationLine = plot(not useLowerDeviation ? na : calculationToPlotLowerLine, color=color(red,0))
fill(plotUpperDeviationLine, plotAverageMeanLine, color=color(blue,85))
fill(plotLowererDeviationLine, plotAverageMeanLine, color=color(red,85))


//
length = input(title="linear Length",  defval=40, minval=1)
multiplier = input(title="linear Deviation", type=float, defval=2, minval=1)
overbought = input(title="Overbought",  defval=1, minval=1)
oversold = input(title="Oversold",  defval=0, minval=1)
custom_timeframe = input(title="Use another Timeframe?", type=bool, defval=false)
highTimeFrame = input(title="Select The Timeframe",  defval="60")
res1 = custom_timeframe ? highTimeFrame : timeframe.period

fixedSL = input(title="SL Activation", defval=70)
trailSL = input(title="SL Trigger", defval=10)
fixedTP = input(title="TP Activation", defval=50)
trailTP = input(title="TP Trigger", defval=10)

// === INPUT BACKTEST RANGE ===
FromMonth = input(defval = 1, title = "From Month", minval = 1, maxval = 12)
FromDay   = input(defval = 1, title = "From Day", minval = 1, maxval = 31)
FromYear  = input(defval = 2019, title = "From Year", minval = 2015)
ToMonth   = input(defval = 1, title = "To Month", minval = 1, maxval = 12)
ToDay     = input(defval = 1, title = "To Day", minval = 1, maxval = 31)
ToYear    = input(defval = 9999, title = "To Year", minval = 2015)

start     = timestamp(FromYear, FromMonth, FromDay, 00, 00)  // backtest start window
finish    = timestamp(ToYear, ToMonth, ToDay, 23, 59)        // backtest finish window
window()  => time >= start and time <= finish ? true : false // create function "within window of time"

smabasis = linreg(close_price, length, 0)
stdev = stdev(close, length)
cierre = request.security(syminfo.tickerid, res1, close, false)
alta = request.security(syminfo.tickerid, res1, high, false)
baja = request.security(syminfo.tickerid, res1, low, false)
basis1 = request.security(syminfo.tickerid, res1, smabasis, false)
stdevb = request.security(syminfo.tickerid, res1, stdev, false)
dev = multiplier * stdevb // stdev(cierre, length)
upper = basis1 + dev
lower = basis1 - dev

bbr = (cierre - lower)/(upper - lower)

// plot(bbr)

// // MARCA LAS RESISTENCIAS
pintarojo = 0.0
pintarojo := nz(pintarojo[1])
pintarojo := bbr[1] > overbought and bbr < overbought ? alta[1] :  nz(pintarojo[1])
p = plot(pintarojo, color = red, style=circles, linewidth=2)

// // MARCA LOS SOPORTES
pintaverde = 0.0
pintaverde := nz(pintaverde[1])
pintaverde := bbr[1] < oversold and bbr > oversold ? baja[1] :  nz(pintaverde[1])
g = plot(pintaverde, color = black, style=circles, linewidth=2)
zz= crossover(pintaverde,pintaverde[1]) or crossunder(pintaverde,pintaverde[1])
kp= crossover(pintarojo,pintarojo[1]) or crossunder(pintarojo,pintarojo[1])
plotshape(zz,  title="buy", style=shape.triangleup,location=location.belowbar, color=green, transp=0, size=size.small)
plotshape(kp, title="sell", style=shape.triangledown,location=location.abovebar, color=red, transp=0, size=size.small)


strategy.entry("BUY", strategy.long, qty=10, oca_name="BUY",  when=zz and window())
strategy.exit("B.Exit", "BUY", qty_percent = 100, loss=fixedSL, trail_offset=trailTP, trail_points=fixedTP)

strategy.entry("SELL", strategy.short, qty=10, oca_name="SELL",  when=kp and window())
strategy.exit("S.Exit", "SELL", qty_percent = 100, loss=fixedSL, trail_offset=trailSL, trail_points=fixedTP)