MACD Trend Following Strategy

Overview
This strategy implements trend following trading on the MACD indicator. It identifies trend direction using MACD and with dynamic stop loss to lock in profits.
Strategy Logic
-
Calculate Fast MA, Slow MA and MACD indicator. Fast MA uses 12-period EMA, Slow MA uses 26-period EMA. MACD is the difference between Fast and Slow MA.
-
Set buy and sell lines. Generate buy signal when MACD crosses over buy line, generate sell signal when MACD crosses below sell line.
-
Set dynamic stop loss after opening position. The initial stop loss is set at 95% of entry price, and will trail upwards as price runs.
-
Close position when stop loss is triggered or reverse signal appears.
Advantage Analysis
-
Using MACD to identify trend direction can effectively track trends.
-
The dynamic stop loss can continuously lock in profits and avoid enlarged losses.
-
The strategy logic is simple and clear, easy to understand and automate for quant trading.
Risk Analysis
-
MACD has lagging effect, may miss short term trend reversal.
-
Stop loss set too loose may miss some profits, too tight may stop out early.
-
Parameter tuning issue. MACD parameters and buy/sell lines need constant testing and optimization.
-
Works better in trending market, may have losses in choppy market.
Optimization Directions
-
Optimize MACD parameters to find best combination.
-
Test different stop loss methods, like fixed points, ATR-based etc.
-
Add filter conditions using other indicators to avoid false signals, e.g. Bollinger Bands, RSI etc.
-
Combine with trend identification tools, dynamically adjust strategy parameters based on trend vs range-bound market.
Summary
The strategy has clear logic of using MACD to track trends and dynamic stop loss to lock in profits. It can effectively track trending markets. But MACD has lagging issue, and stop loss points need to be optimized. Next step is to further test parameters, optimize stop loss mechanism, add filters with other indicators, to make it robust across different market conditions, improving stability.
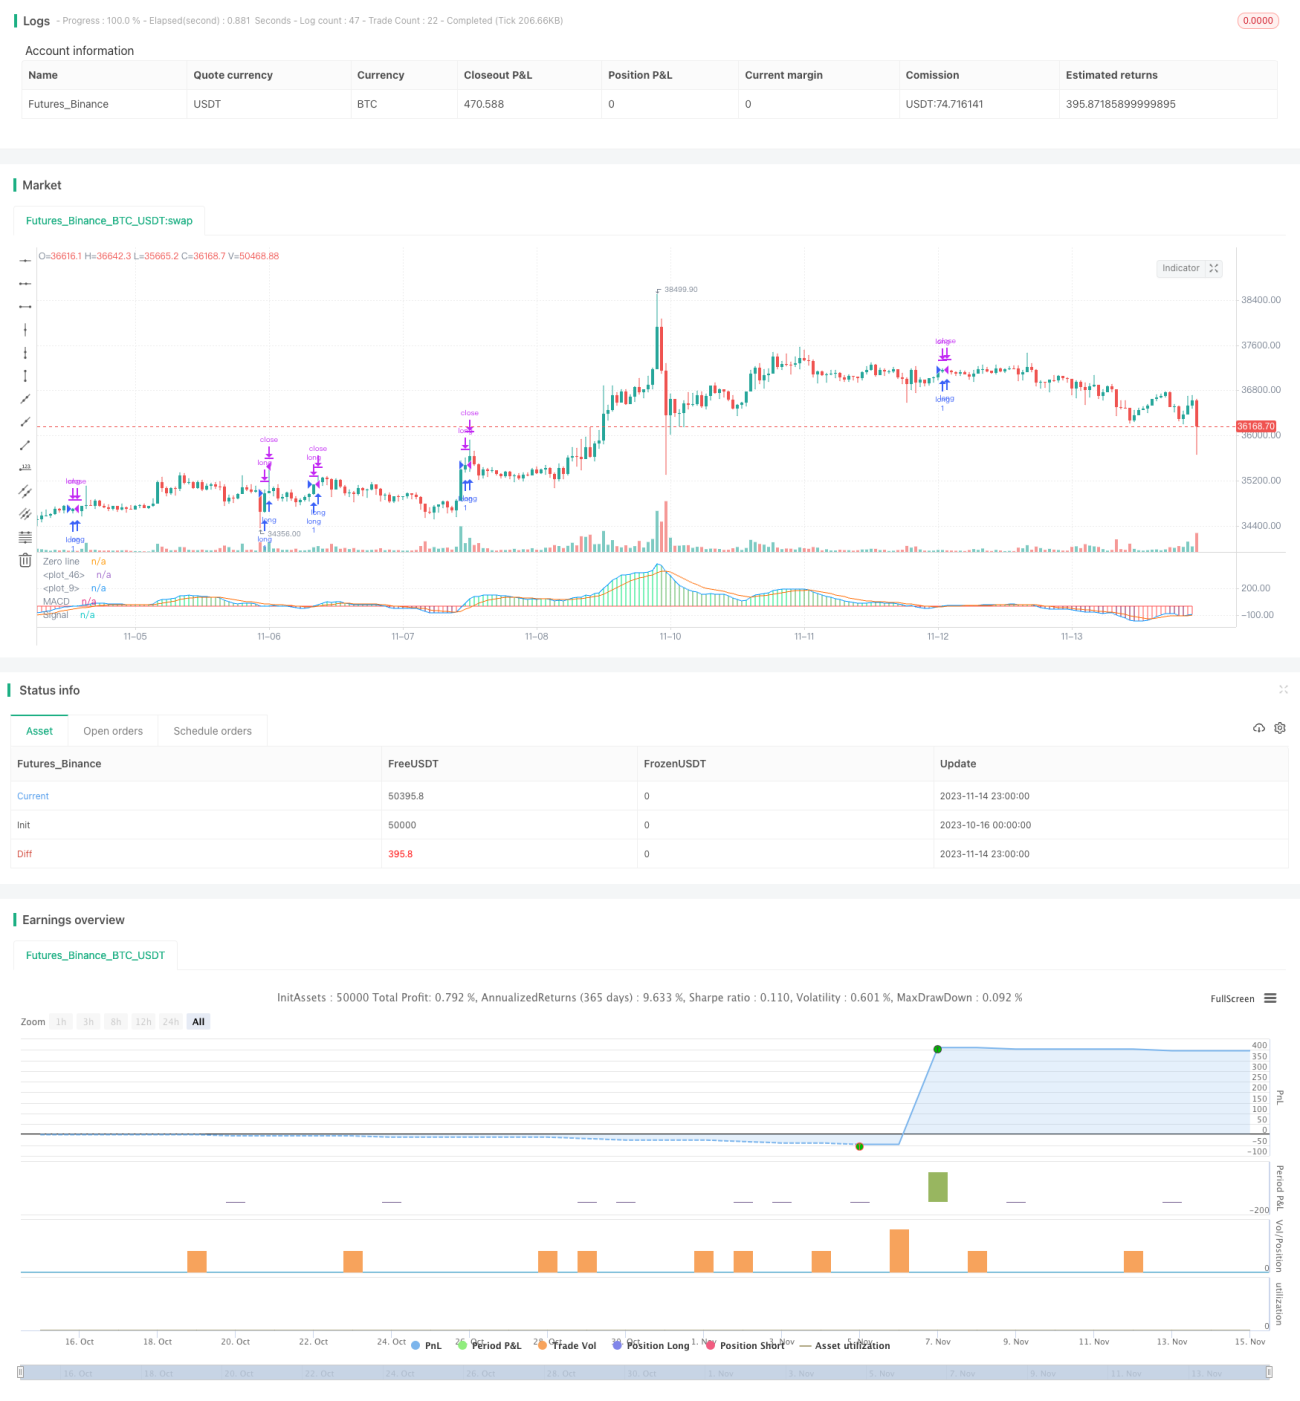
/*backtest
start: 2023-10-16 00:00:00
end: 2023-11-15 00:00:00
period: 1h
basePeriod: 15m
exchanges: [{"eid":"Futures_Binance","currency":"BTC_USDT"}]
*/

//@version=3
strategy(shorttitle = "EURUSD MACD", title = "EURUSD MACD")
fastMA = input(title="Fast moving average",  defval = 12, minval = 7)
slowMA = input(title="Slow moving average", defval = 26, minval = 7)- 1