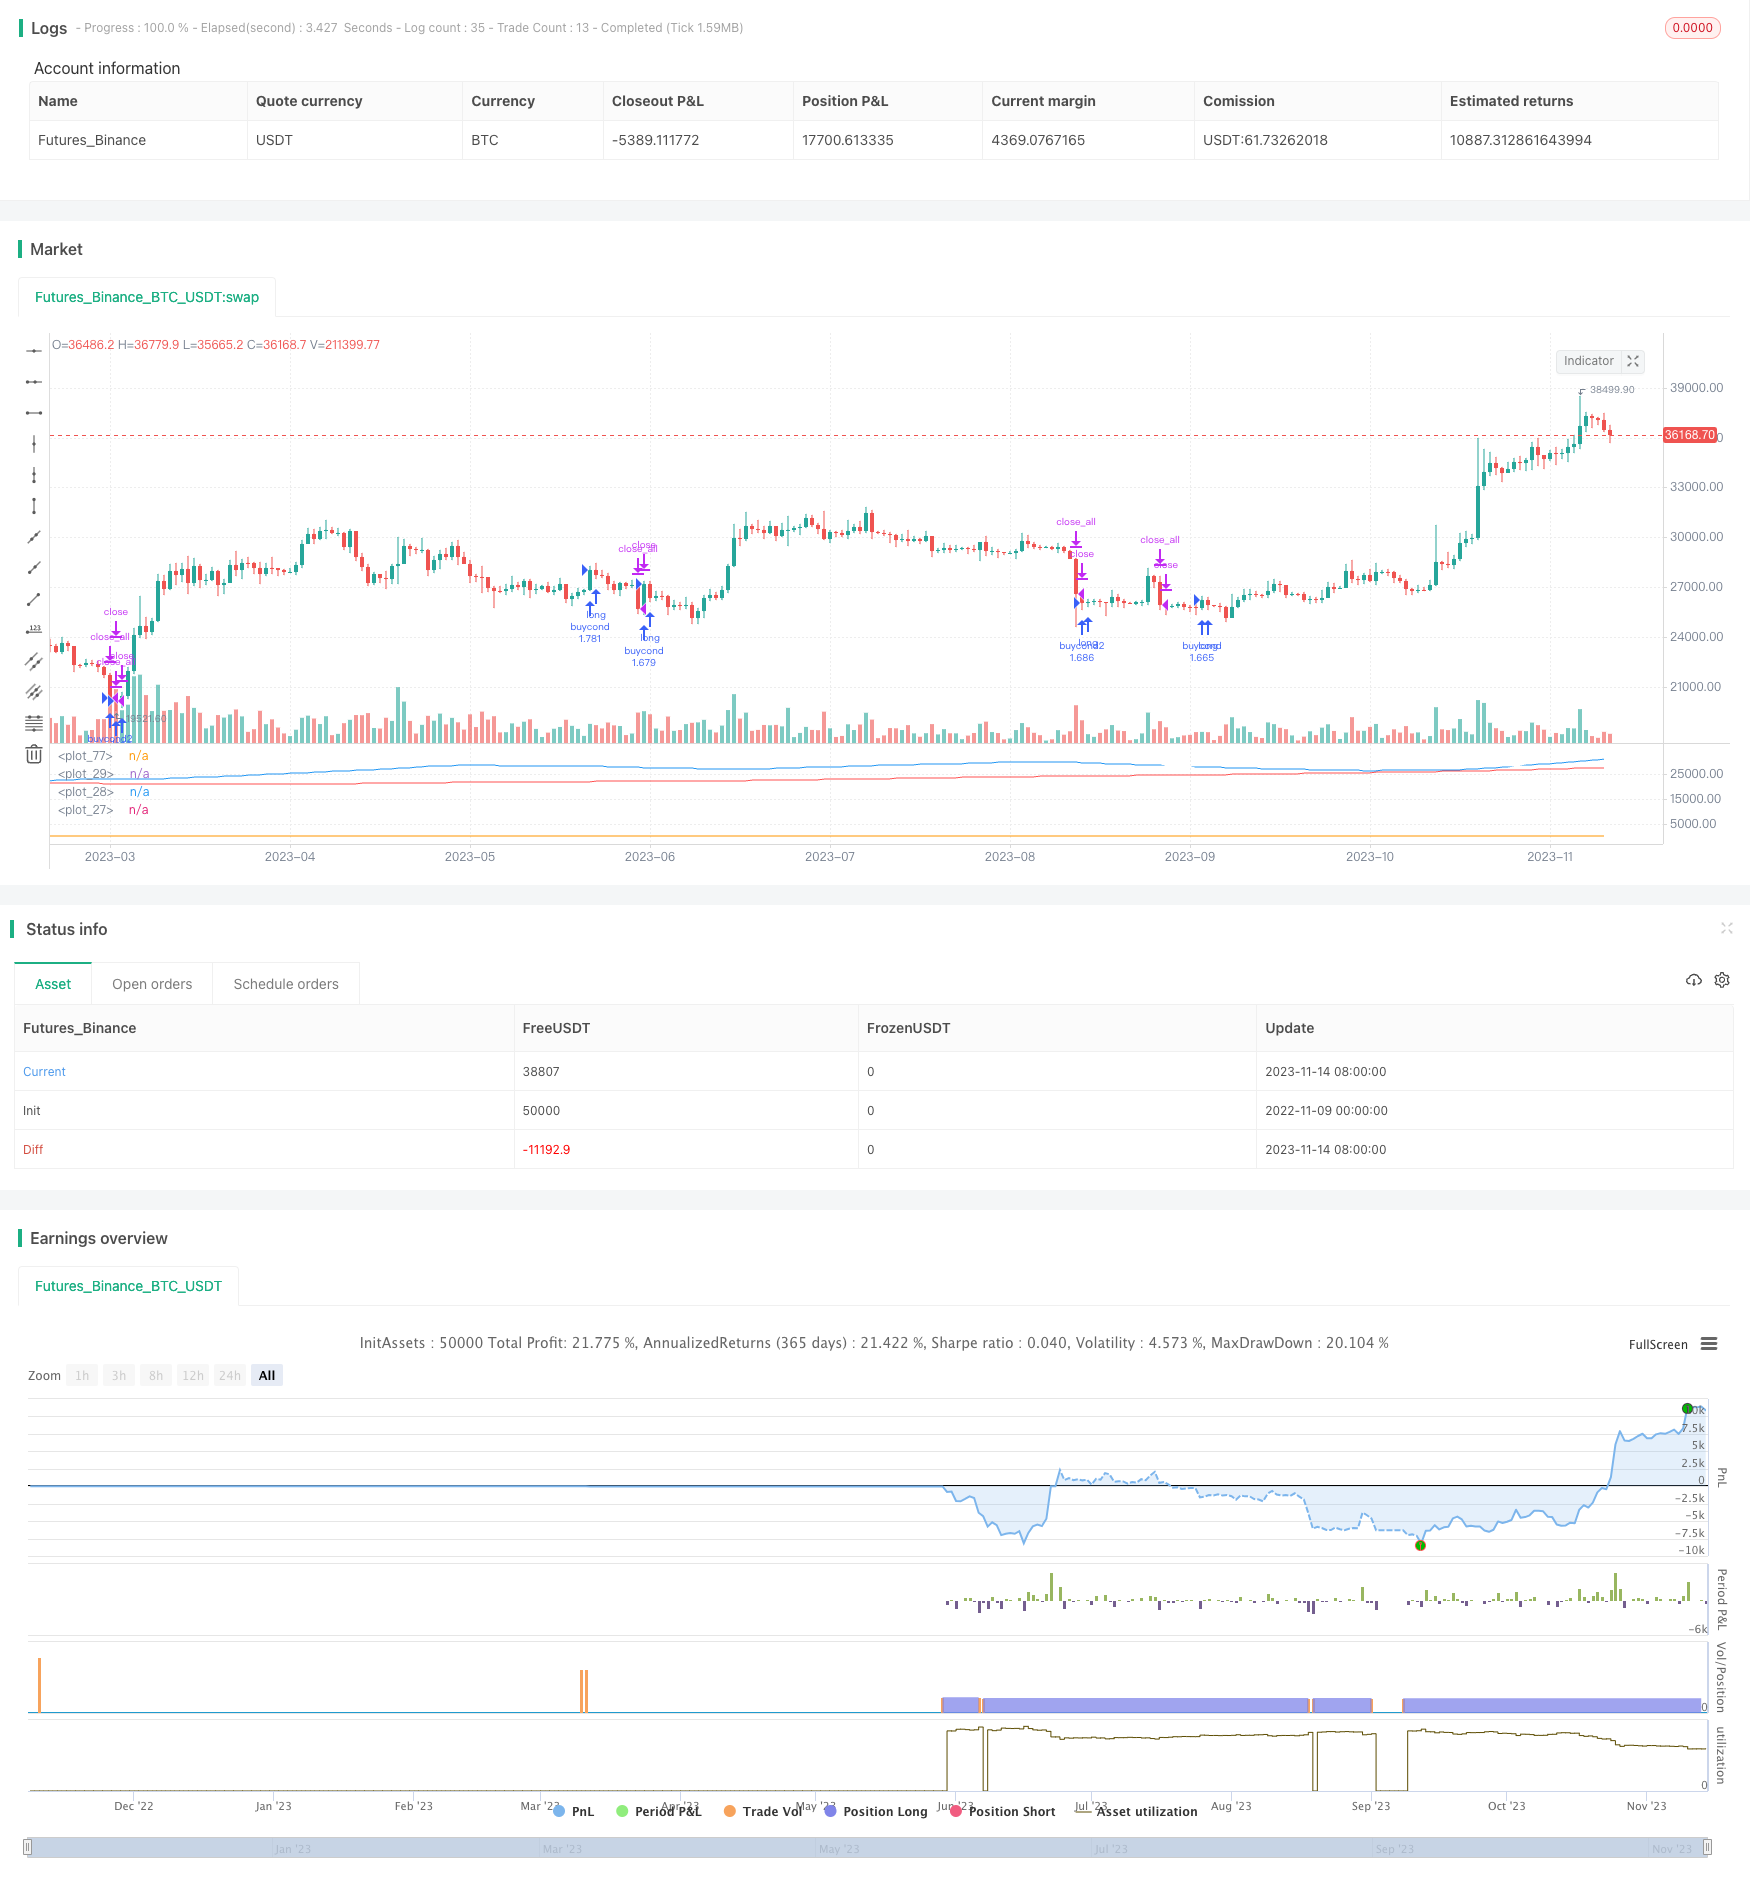
概述
动量振荡枯竭策略是一种趋势跟踪策略,它利用移动平均线和价格百分比振荡指标来尽量减少下跌风险。该策略属于指数基金交易模型,可以有效控制风险。
策略原理
该策略的核心指标是枯竭值和枯竭均线。枯竭值是价格振荡的一个量度指标,它由收盘价、最高价和最低价计算得到。具体计算方法是:(收盘价+最高价+最低价-枯竭值的移动平均)/(枯竭值的移动平均)。枯竭均线则是枯竭值的移动平均线。当枯竭值上穿枯竭均线时,表示行情出现盘整,可能形成新的趋势;当枯竭值下穿枯竭均线时,表示趋势反转,应该考虑止盈了结。
此外,策略还利用长短期移动平均线辅助判断趋势,包括300日线、150日线和50日线。当短期移动平均线下穿长期移动平均线时,表示趋势反转,应该考虑止损。
MACD也用于短期买卖点判断。当MACD线上穿信号线时看涨,下穿信号线时看跌。RSI低位也作为买入信号使用。
具体的入场和出场逻辑是:
买入条件:枯竭值上穿枯竭均线,且50日线高于150日线;或者RSI低于30。
短期止损条件:枯竭值下穿枯竭均线;或MACD下穿信号线。
中长期止损条件:50日线下穿150日线;或150日线下穿300日线。
策略优势
该策略结合多种指标判断趋势 endtime exhaustion 来控制风险,具有以下优势:
枯竭指标可以有效判断盘整和反转。及时发现趋势反转是有效控制风险的关键。
运用多时间周期移动平均线判断趋势,避免被短期市场噪音误导。
MACD辅助确认买卖点,提高策略的实战效果。
RSI指标发挥低买高卖的效用,在超跌时机买入。
明确的止盈止损策略,能够有效控制每次交易的风险。
策略风险
该策略也存在一定的风险:
基于多种指标判断,参数设置不当可能导致交易信号错误。需要反复测试优化参数。
枯竭指标并非完全可靠,价格出现低背离时可能失效。
止损点设置不当可能造成超短线震荡而被止损。止损点要兼顾策略的长短效果。
大盘整体震荡时,指标将失效,需要注意控制仓位规模。
策略优化方向
该策略可以从以下几个方面进行优化:
测试不同参数组合,寻找最佳参数以减少错误信号。可调节的关键参数包括均线周期、枯竭值周期等。
结合波动率指标如ATR来动态调整止损幅度,在大波动时适当放宽止损幅度。
优化仓位管理,不同大盘阶段可以预设不同的仓位比例规则。
结合积累线、支撑线等图形指标提高策略的实战效果。
增加机器学习算法,辅助判断关键指标的效力,实现动态优化。
总结
动量枯竭策略综合运用多种指标判断趋势反转,以控制交易风险。该策略具有趋势跟踪能力,可有效判断买卖时机。通过参数优化、止损规则设定、图形指标辅助等方式可以进一步提升策略效果。总体来说,该策略对大盘震荡有一定的适应能力,可作为风险控制型策略选项之一。
/*backtest
start: 2022-11-09 00:00:00
end: 2023-11-15 00:00:00
period: 1d
basePeriod: 1h
exchanges: [{"eid":"Futures_Binance","currency":"BTC_USDT"}]
*/

// This source code is subject to the terms of the Mozilla Public License 2.0 at https://mozilla.org/MPL/2.0/
// © spiritualhealer117

//@version=4

strategy("Infiten Slope Strategy", overlay=false,calc_on_every_tick = true, default_qty_type=strategy.percent_of_equity, default_qty_value = 100)
// //TIME RESTRICT FOR BACKTESTING {
// inDateRange = (time >= timestamp(syminfo.timezone, 2003,
//          1, 1, 0, 0)) and
//      (time < timestamp(syminfo.timezone, 2021, 5, 25, 0, 0))
// //}

//OPTIMAL PARAMETERS {
daysback = 30
volumesens = 1.618
//}
//Calculating Exhaustion and Exhaustion Moving Average {
clh = close+low+high
exhaustion = (clh-sma(clh,daysback))/sma(clh,daysback)
exhaustionSma = sma(exhaustion,daysback)
//}
//Long Term Moving Averages for sell signals {
red = sma(close,300)
white = sma(close,150)
blue = sma(close,50)

plot(red,color=color.red)
plot(white,color=color.white)
plot(blue,color=color.blue)
//}
//MACD Calculation {
fast_length = input(title="Fast Length", type=input.integer, defval=12)
slow_length = input(title="Slow Length", type=input.integer, defval=26)
src = input(title="Source", type=input.source, defval=close)
signal_length = input(title="Signal Smoothing", type=input.integer, minval = 1, maxval = 50, defval = 9)
sma_source = input(title="Simple MA (Oscillator)", type=input.bool, defval=false)
sma_signal = input(title="Simple MA (Signal Line)", type=input.bool, defval=false)
// Calculating
fast_ma = sma_source ? sma(src, fast_length) : ema(src, fast_length)
slow_ma = sma_source ? sma(src, slow_length) : ema(src, slow_length)
macd = fast_ma - slow_ma
signal = sma_signal ? sma(macd, signal_length) : ema(macd, signal_length)
hist = macd - signal
//}
//SIGMOID Bottom {
timeAdjust = 300/sma(close,500)
//}
//RSI bottom {
len = input(14, minval=1, title="Length")
up = rma(max(change(src), 0), len)
down = rma(-min(change(close), 0), len)
rsi = down == 0 ? 100 : up == 0 ? 0 : 100 - (100 / (1 + up / down))
//}

//Entry and exit conditions {
//Sell conditions
bigVolume = sma(volume,30)*volumesens
sellcond1 = crossunder(exhaustion,exhaustionSma) and volume > bigVolume
sellcond2 = crossunder(macd,signal) and volume > bigVolume
midtermsellcond1 = crossunder(blue,white)
longtermsellcond1 = white < red

//Buy conditions
buycond = crossover(exhaustion,exhaustionSma) and not longtermsellcond1
buycond2 = rsi < 30
buycond3 = crossover(blue,white) and longtermsellcond1
//}

//Backtest Run Buy/Sell Commands {
strategy.entry("buycond",true, when=buycond and bigVolume)
strategy.entry("buycond2",true, when=buycond2 and bigVolume)

strategy.close_all(when=sellcond1,comment="short term sell signal 1")
strategy.close_all(when=midtermsellcond1, comment="mid term sell signal 1")
strategy.close_all(when=longtermsellcond1, comment="long term sell signal 1")
strategy.close_all(when=sellcond2, comment="short term sell signal 2")
plot(strategy.position_size)

//Sell on last tested day (only for data collection)
//strategy.close_all(when=not inDateRange)
//}