Momentum Double Moving Average Strategy

Overview
This strategy uses the momentum double moving average crossover method to implement low risk trading. It utilizes two moving averages of different periods, a fast line and a slow line, to determine entry and exit signals based on their crossover. The goal of this strategy is to capture trend changes and generate long-term profits during major trends.
Strategy Logic
The strategy generates trading signals based on the crossover of a fast WMA line and a slow WMA line. The period of the fast line is half of the slow line's period. A buy signal is generated when the fast line crosses above the slow line from below. A sell signal is generated when the fast line crosses below the slow line from above. To filter out false signals, it also incorporates a momentum indicator based on the difference between two moving averages. A trade signal is only generated when the MA crossover occurs concurrently with the momentum indicator fulfilling shape requirements.
Specifically, the key logic includes:
-
Define price input and parameters: get OHLC price data; define parameters HullMA period z, price data p.
-
Calculate dual MAs: compute 2-period MA n2ma, z-period MA nma.
-
Compute MA difference: calculate difference between two MAs diff.
-
Compute momentum indicator: calculate moving average of diff - n1, n2, n3 with period sqn.
-
Determine crossover: mark n1 above n2 as green, otherwise red.
-
Plot shapes: plot n1 and n2.
-
Identify signals: generate signal when n1, n2, n3 align in same direction.
-
Enter and exit: go long when fast line above slow line and momentum indicator agrees; go short when fast line below slow line and momentum indicator agrees.
Advantages
Combining dual MA crossover and momentum indicator, this strategy can effectively filter out false signals and only generate trades at the start of trend changes, thus producing good strategy performance.
-
MA crossover detects changes in trend, profiting from trends.
-
Momentum indicator filters out false signals, avoiding being misled by short-term fluctuations.
-
Only trading on major trend changes reduces unnecessary trading frequency.
-
Parameter optimization fits the characteristics of different products.
-
Allowing some degree of pyramiding stretches out profit cycles.
Risks
There are also some risks to be aware of:
-
Dual MA crossover has lag in detecting trend changes, potentially missing best timing.
-
Improper parameter settings on momentum indicator may generate bad signals.
-
Imbalance exists between long and short holding periods.
-
The strategy lacks mechanisms to handle choppy market conditions well.
-
Risk of over-optimization exists, requiring stepwise optimization of parameters.
Some solutions:
-
Consider adding other leading indicators to detect price changes early.
-
Optimize parameters of momentum indicator to find best combinations.
-
Add volatility indicator to control holding period.
-
Limit position sizing to reduce single loss.
-
Test for parameter robustness to avoid over-optimization.
Improvement Directions
The strategy can be improved in the following aspects:
-
Test different types of MAs to find optimal parameters for each product.
-
Add other indicators like MACD, Bollinger Bands to determine trend changes.
-
Optimize entry timing to accurately determine turning points.
-
Optimize exits using trailing stops to lock in profits.
-
Perform parameter optimization according to product characteristics.
-
Employ machine learning to find optimal parameter combinations.
-
Build dynamic position sizing mechanisms to control risks.
-
Add quantitative metrics like Sharpe ratio, profit factor for strategy evaluation.
-
Assess performance on historical data using backtesting engine.
Summary
In summary, this momentum double MA strategy identifies major trend reversal points using MA crossover and momentum, enabling low-risk trading. It has advantages like stable profits and simple implementation, but also issues to improve like parameter optimization and risk control. We can refine areas like entry/exit timing, dynamic position sizing to better adapt to market conditions. Extensive validation and evaluation are critical for ensuring robust strategy performance. Overall, this strategy provides a simple yet effective approach to quantitative trading, but requires continuous optimizations and validations to generate consistent investment returns.
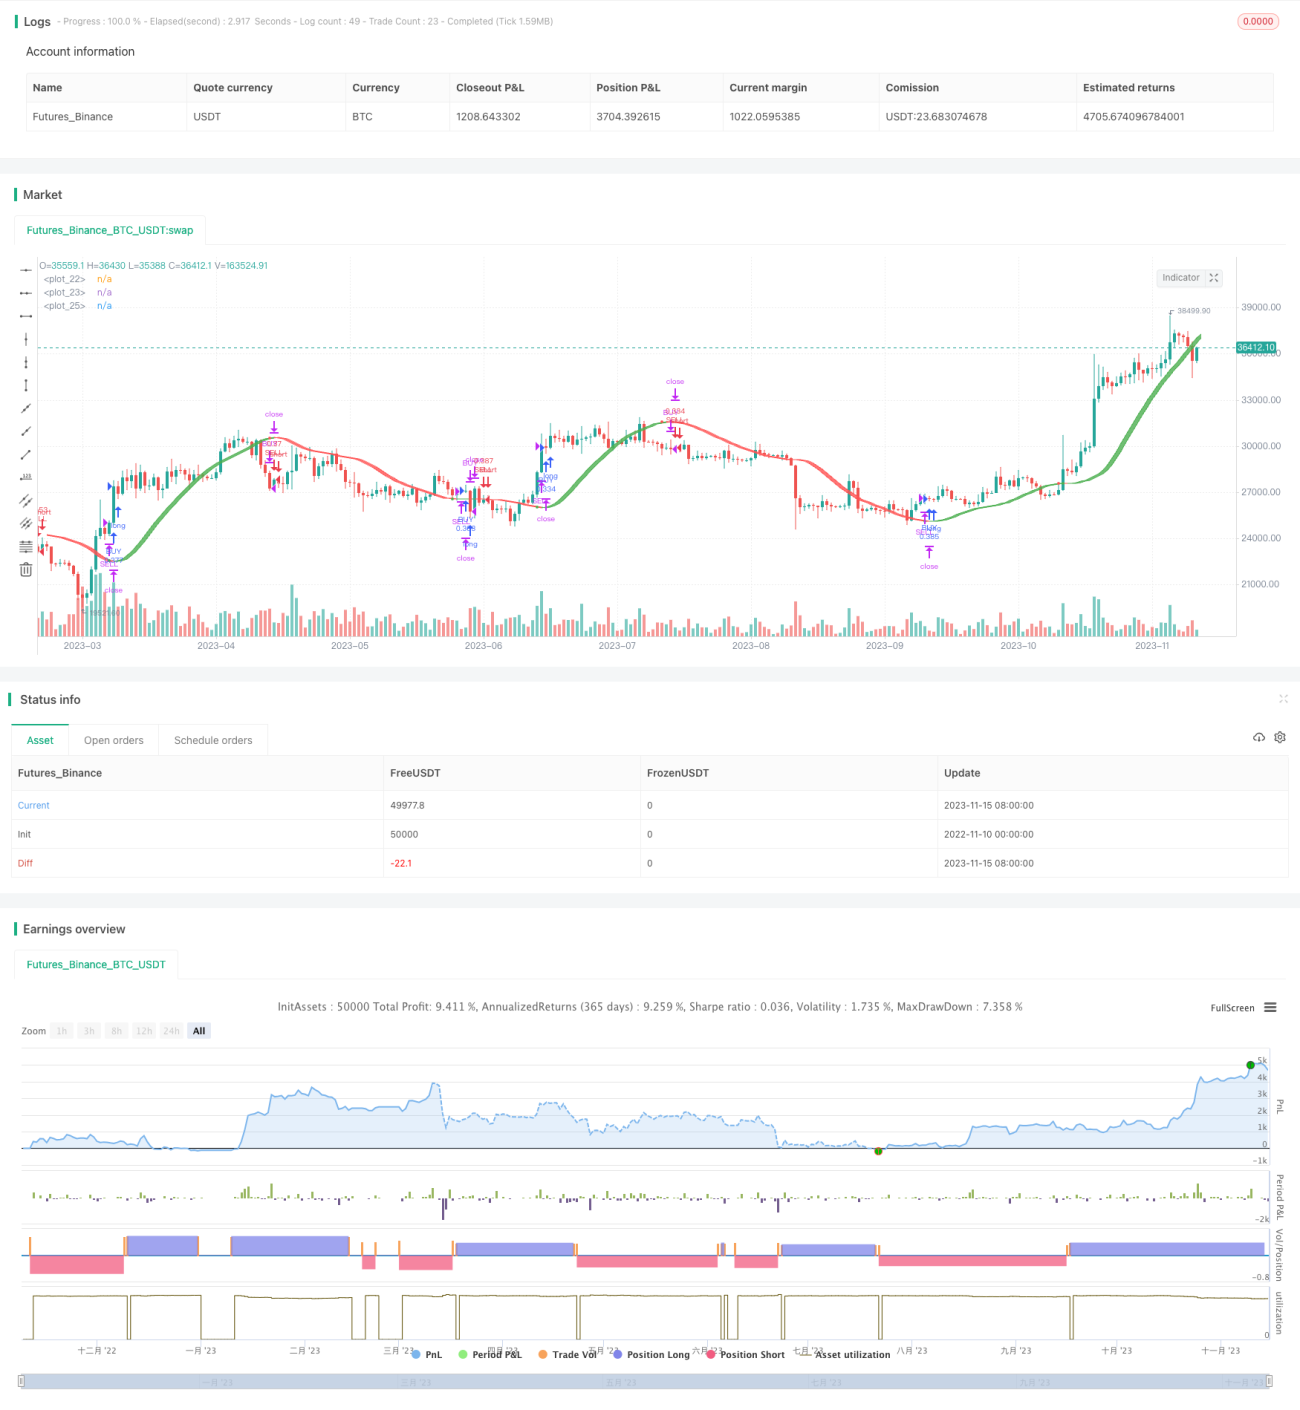
/*backtest
start: 2022-11-10 00:00:00
end: 2023-11-16 00:00:00
period: 1d
basePeriod: 1h
exchanges: [{"eid":"Futures_Binance","currency":"BTC_USDT"}]
*/

//@version=2
//OCTOPUS Indicator Strategy
strategy("FAVEL corp. Indicator Strategy", shorttitle="FAVEL corp. Monarch", overlay=true, default_qty_type=strategy.percent_of_equity, max_bars_back=420, default_qty_value=20, calc_on_order_fills= true, calc_on_every_tick=true, pyramiding=0)
z=input(defval=60,title="HullMA cross")- 1