Multi-factor Momentum Reversal Combo Strategy

Overview
This strategy is a multi-factor combo strategy that combines reversal factors and momentum factors to discover reversal opportunities in the market. The strategy first uses the long-term reversal factor to identify reversal opportunities after range-bound declines, and then uses momentum indicators for secondary screening to filter out false reversal signals under major trends, so as to lock in short-term reversal arbitrage opportunities.
Strategy Logic
The strategy consists of two parts:
-
123 Reversal Factor
This part uses the idea of intraday reversal to determine the relationship between the closing price of the previous day and the closing price of the 2 days ago to identify reversal opportunities with slow K-line. The specific logic is:
-
Buy signal: After two consecutive days of decline in the closing price, if the closing price rises on the current day, and the 9-day slow K-line is lower than 50, a buy signal is generated;
-
Sell signal: After two consecutive days of rise in the closing price, if the closing price declines on the current day, and the 9-day fast K-line is higher than 50, a sell signal is generated.
-
-
Ehlers Dynamic Momentum Oscillator (ETSI)
This part uses the three EMA smoothing price momentum method to construct a momentum indicator. The formula for the indicator is as follows:
mylangxPrice1 = close - close[1] xPrice2 = abs(close - close[1]) xSMA_R = EMA(EMA(EMA(xPrice1,r), s), u) xSMA_aR = EMA(EMA(EMA(xPrice2, r), s), u) xTSI = xSMA_R / xSMA_aR * 100 xEMA_TSI = EMA(xTSI, N)Where xSMA_R is the EMA smoothed value of price momentum, xSMA_aR is the EMA smoothed value of price volatility, xTSI is the momentum indicator constructed from the ratio of the two, and xEMA_TSI is the secondary EMA smoothing of xTSI. The indicator determines the trading signal direction based on the relationship between xTSI and xEMA_TSI.
Finally, the strategy ANDs the signals from the two parts, and only issues actual trading orders when the signals from both factors agree.
Advantages of the Strategy
The biggest advantage of this strategy lies in its multi-factor design, which can filter out false signals and discover high-quality trading opportunities. Specifically, there are three main points:
-
The 123 reversal factor can identify short-term rebound points after range-bound declines.
-
The Ehlers momentum indicator can effectively determine the direction of the major trend to avoid reversal signals occurring under a major trend, thereby filtering out false signals.
-
The AND operation on the two signal parts can improve signal quality and enhance strategy stability.
Risks of the Strategy
Although the strategy adopts a multi-factor design to control risks, there are still the following main risks:
-
Reversal signals may occur in oscillating trends and fail to profit.
-
There is subjectivity in the parameter settings between the two factors, which may overfit specific products.
-
The risk of increased losses after the price reversal reverses again.
These risks can be mitigated by optimizing parameters to adapt to more varieties, controlling post-reversal positions, real-time monitoring of changes in indicator relationships, and other means.
Optimization Directions
The main aspects for optimizing this strategy include:
-
Adjusting the parameters of the two factors to find data samples that match better.
-
Increasing stop loss strategies to control single loss.
-
Using different parameter combinations for trending and oscillating varieties.
-
Increasing the factor weighting mechanism to give better performing factors greater weight.
-
Increasing machine learning algorithms to achieve automatic optimization and updating of parameters.
Conclusion
The strategy successfully combines reversal factors and momentum indicators to achieve multi-factor optimized design. It can effectively identify short-term reversal opportunities and use momentum indicators to conduct secondary verification of the signals, thereby improving the win rate of the strategy. Although there is still room for improvement in the strategy, its core idea provides a good reference for the design of quantitative strategies.
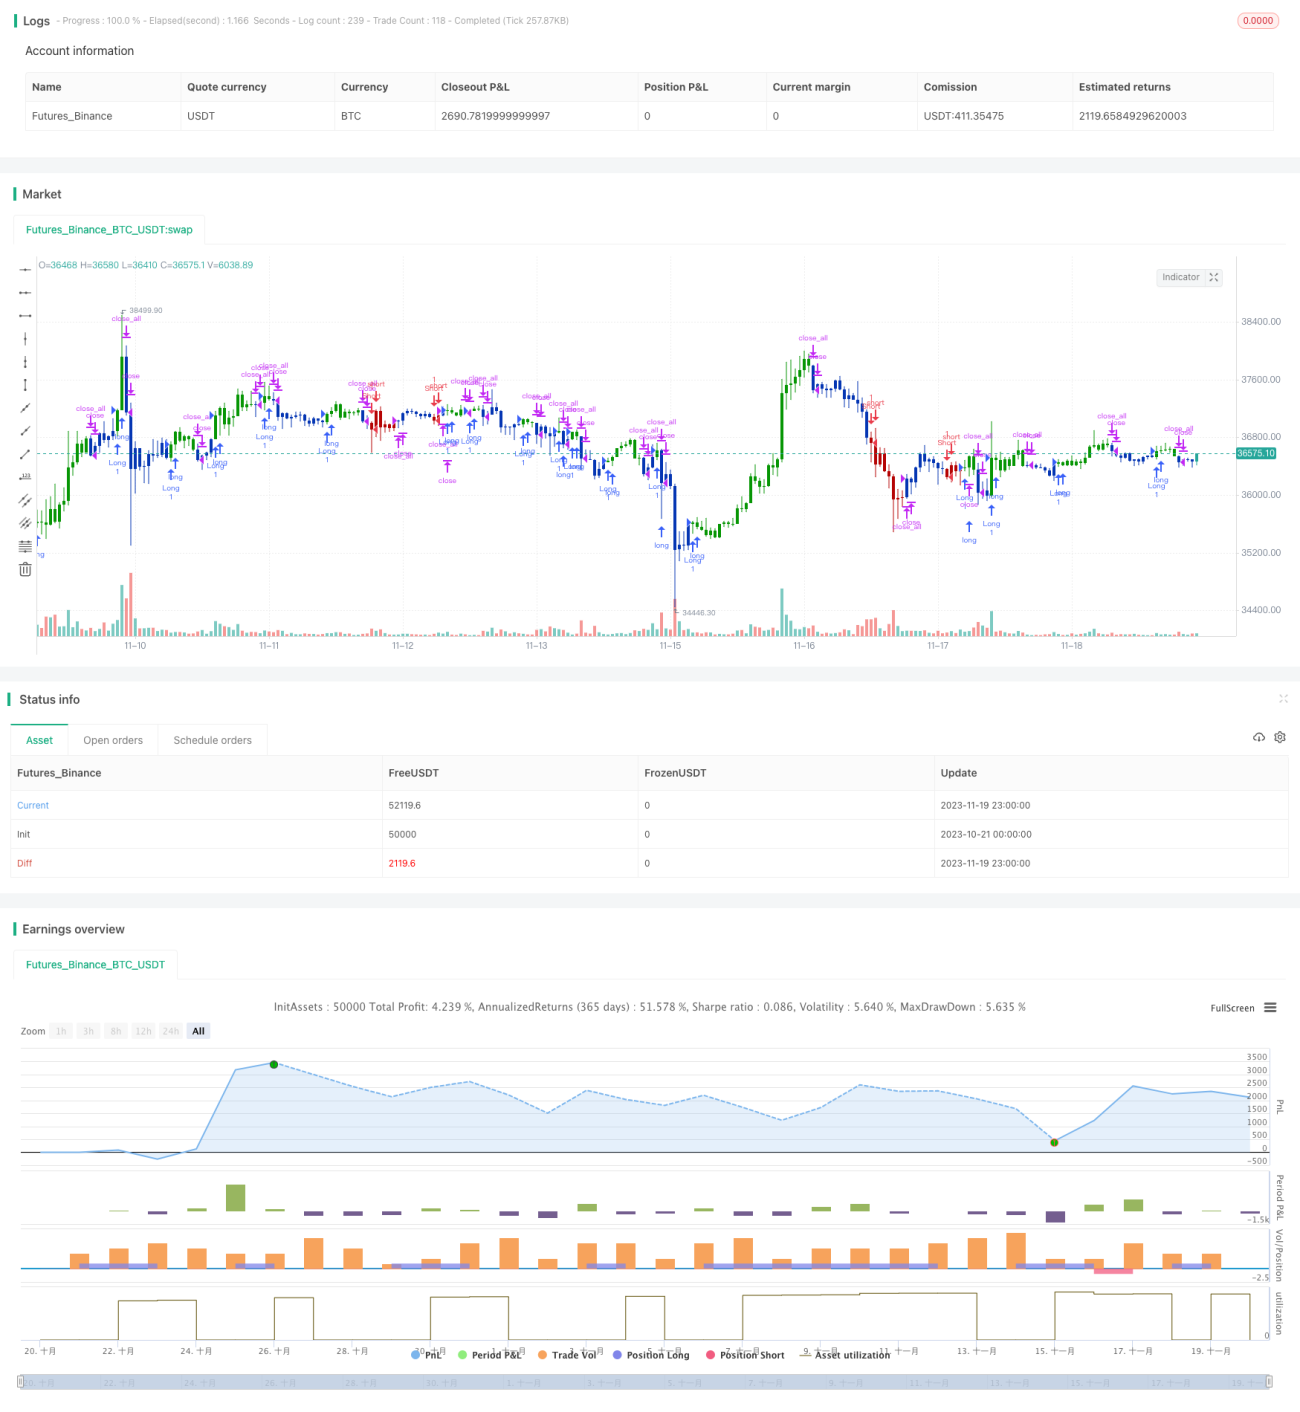
/*backtest
start: 2023-10-21 00:00:00
end: 2023-11-20 00:00:00
period: 1h
basePeriod: 15m
exchanges: [{"eid":"Futures_Binance","currency":"BTC_USDT"}]
*/

//@version=4
////////////////////////////////////////////////////////////
//  Copyright by HPotter v1.0 30/07/2020
// This is combo strategies for get a cumulative signal. - 1