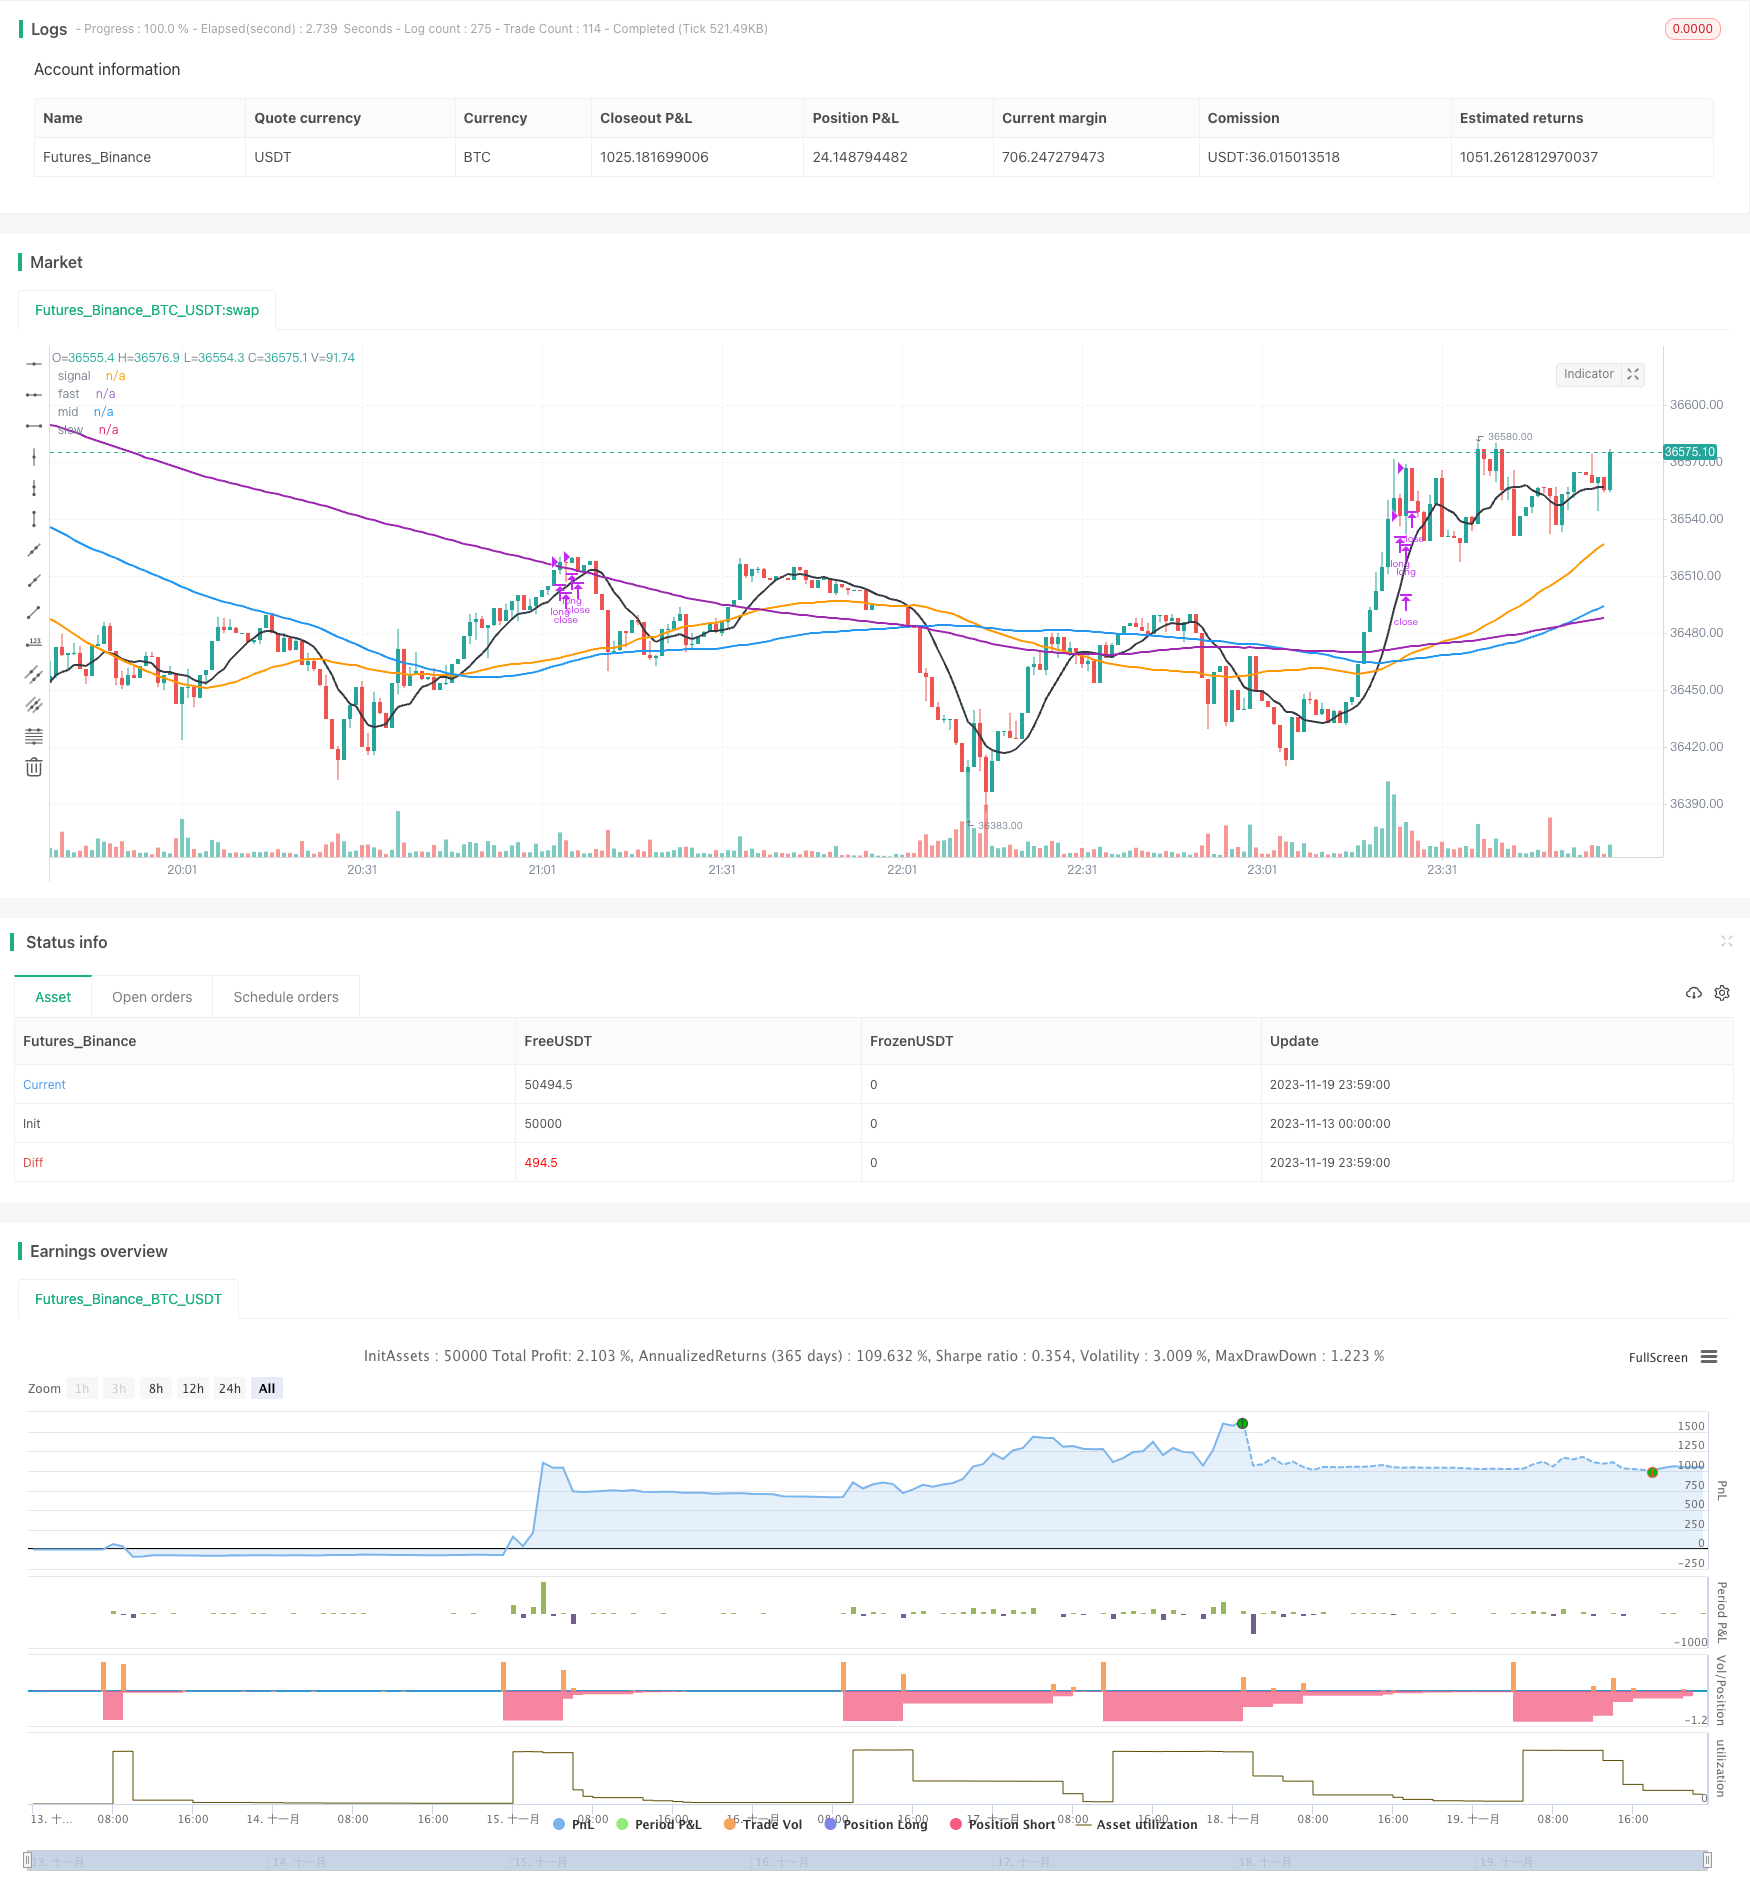
概述
该策略通过RSI指标判断超买超卖,结合快线、中线、慢线构建的趋势判断体系,在价格跃动的时候判断机会建仓做多做空。
策略原理
使用RSI指标判断超买超卖
- RSI参数设置为14周期
- 超卖线为30,超买线为70
使用三条不同周期的SMA均线判断趋势
- 快线为9周期SMA,代表短期趋势
- 中线为50周期SMA,代表中期趋势
- 慢线为200周期SMA,代表长期趋势
当快线上穿中线,并且RSI指标显示超卖时,做多入场
当快线下穿中线,并且RSI指标显示超买时,做空入场
停损设置为入场价格的4%
获利方式为分批止盈,首先止盈20%,然后在价格继续上涨时止盈15%,依次退出仓位
优势分析
- 使用三条不同周期的SMA均线,能对不同时间段的趋势变化做出判断
- RSI指标的使用避免在非超买超卖区域建仓
- 分批止盈增加了策略持仓周期,也增加了持仓平均获利
风险分析
- 三条均线发出错误信号的概率
- 分批止盈存在未全部成交的风险
- 需要选择合适的股票品种,适合价格波动较大的股票
策略优化方向
- 可以测试修改均线和RSI的参数,优化入场和出场机会
- 可以增加其他指标过滤 candle 形态等,提高策略准确率
- 可以通过动态跟踪止损,进一步控制风险
总结
本策略结合均线指标和超买超卖指标RSI,在捕捉价格变化趋势的同时对买卖机会进行判断,属于较为常见的跟踪趋势策略。通过参数测试和增加其他辅助判断指标,可以进一步优化和提高策略胜率。
策略源码
/*backtest
start: 2023-11-13 00:00:00
end: 2023-11-20 00:00:00
period: 1m
basePeriod: 1m
exchanges: [{"eid":"Futures_Binance","currency":"BTC_USDT"}]
*/

// This source code is subject to the terms of the Mozilla Public License 2.0 at https://mozilla.org/MPL/2.0/
// © syfuslokust

//@version=4
strategy(shorttitle='CoinruleCombinedCryptoStrat',title='CoinruleCombinedCryptoStrat', overlay=true)


// RSI inputs and calculations
lengthRSI = 14
RSI = rsi(close, lengthRSI)
//Normal
oversold = input(30)
overbought =  input(70)
//ALGO
//oversold= input(26)
//overbought= input(80)

//sell pct
SellPct = input(20)
ExitPct = input(15)

//MA inputs and calculations
movingaverage_signal = sma(close, input(9))
movingaverage_fast = sma(close, input(50))
movingaverage_slow = sma(close, input(200))
movingaverage_mid= sma(close, input(100))

//Look Back
inp_lkb = input(12, title='Lookback Long Period')
inp_lkb_2 = input(2, title='Lookback Short Period')

perc_change(lkb) =>
    overall_change = ((close[0] - close[lkb]) / close[lkb]) * 100

//Entry

//MA
bullish = crossover(movingaverage_signal, movingaverage_fast)
//Execute buy
strategy.entry(id="long", long = true, when = (RSI < oversold and movingaverage_fast < movingaverage_mid))

//when = crossover(close, movingaverage_signal) and movingaverage_signal < movingaverage_slow and RSI < oversold)

//Exit

//RSI
Stop_loss= ((input (4))/100)
longStopPrice  = strategy.position_avg_price * (1 - Stop_loss)
//MA
bearish = crossunder(movingaverage_signal, movingaverage_fast)
//Execute sell
strategy.close("long", qty_percent = SellPct, when = RSI > overbought and movingaverage_fast > movingaverage_mid)
//when = (crossunder(low, movingaverage_signal) and movingaverage_fast > movingaverage_slow and RSI > overbought) or (movingaverage_signal < movingaverage_fast and crossunder(low, movingaverage_fast)) or (low < longStopPrice))


//PLOT
plot(movingaverage_signal, color=color.black, linewidth=2, title="signal")
plot(movingaverage_fast, color=color.orange, linewidth=2, title="fast")
plot(movingaverage_slow, color=color.purple, linewidth=2, title="slow")
plot(movingaverage_mid, color=color.blue, linewidth=2, title="mid")