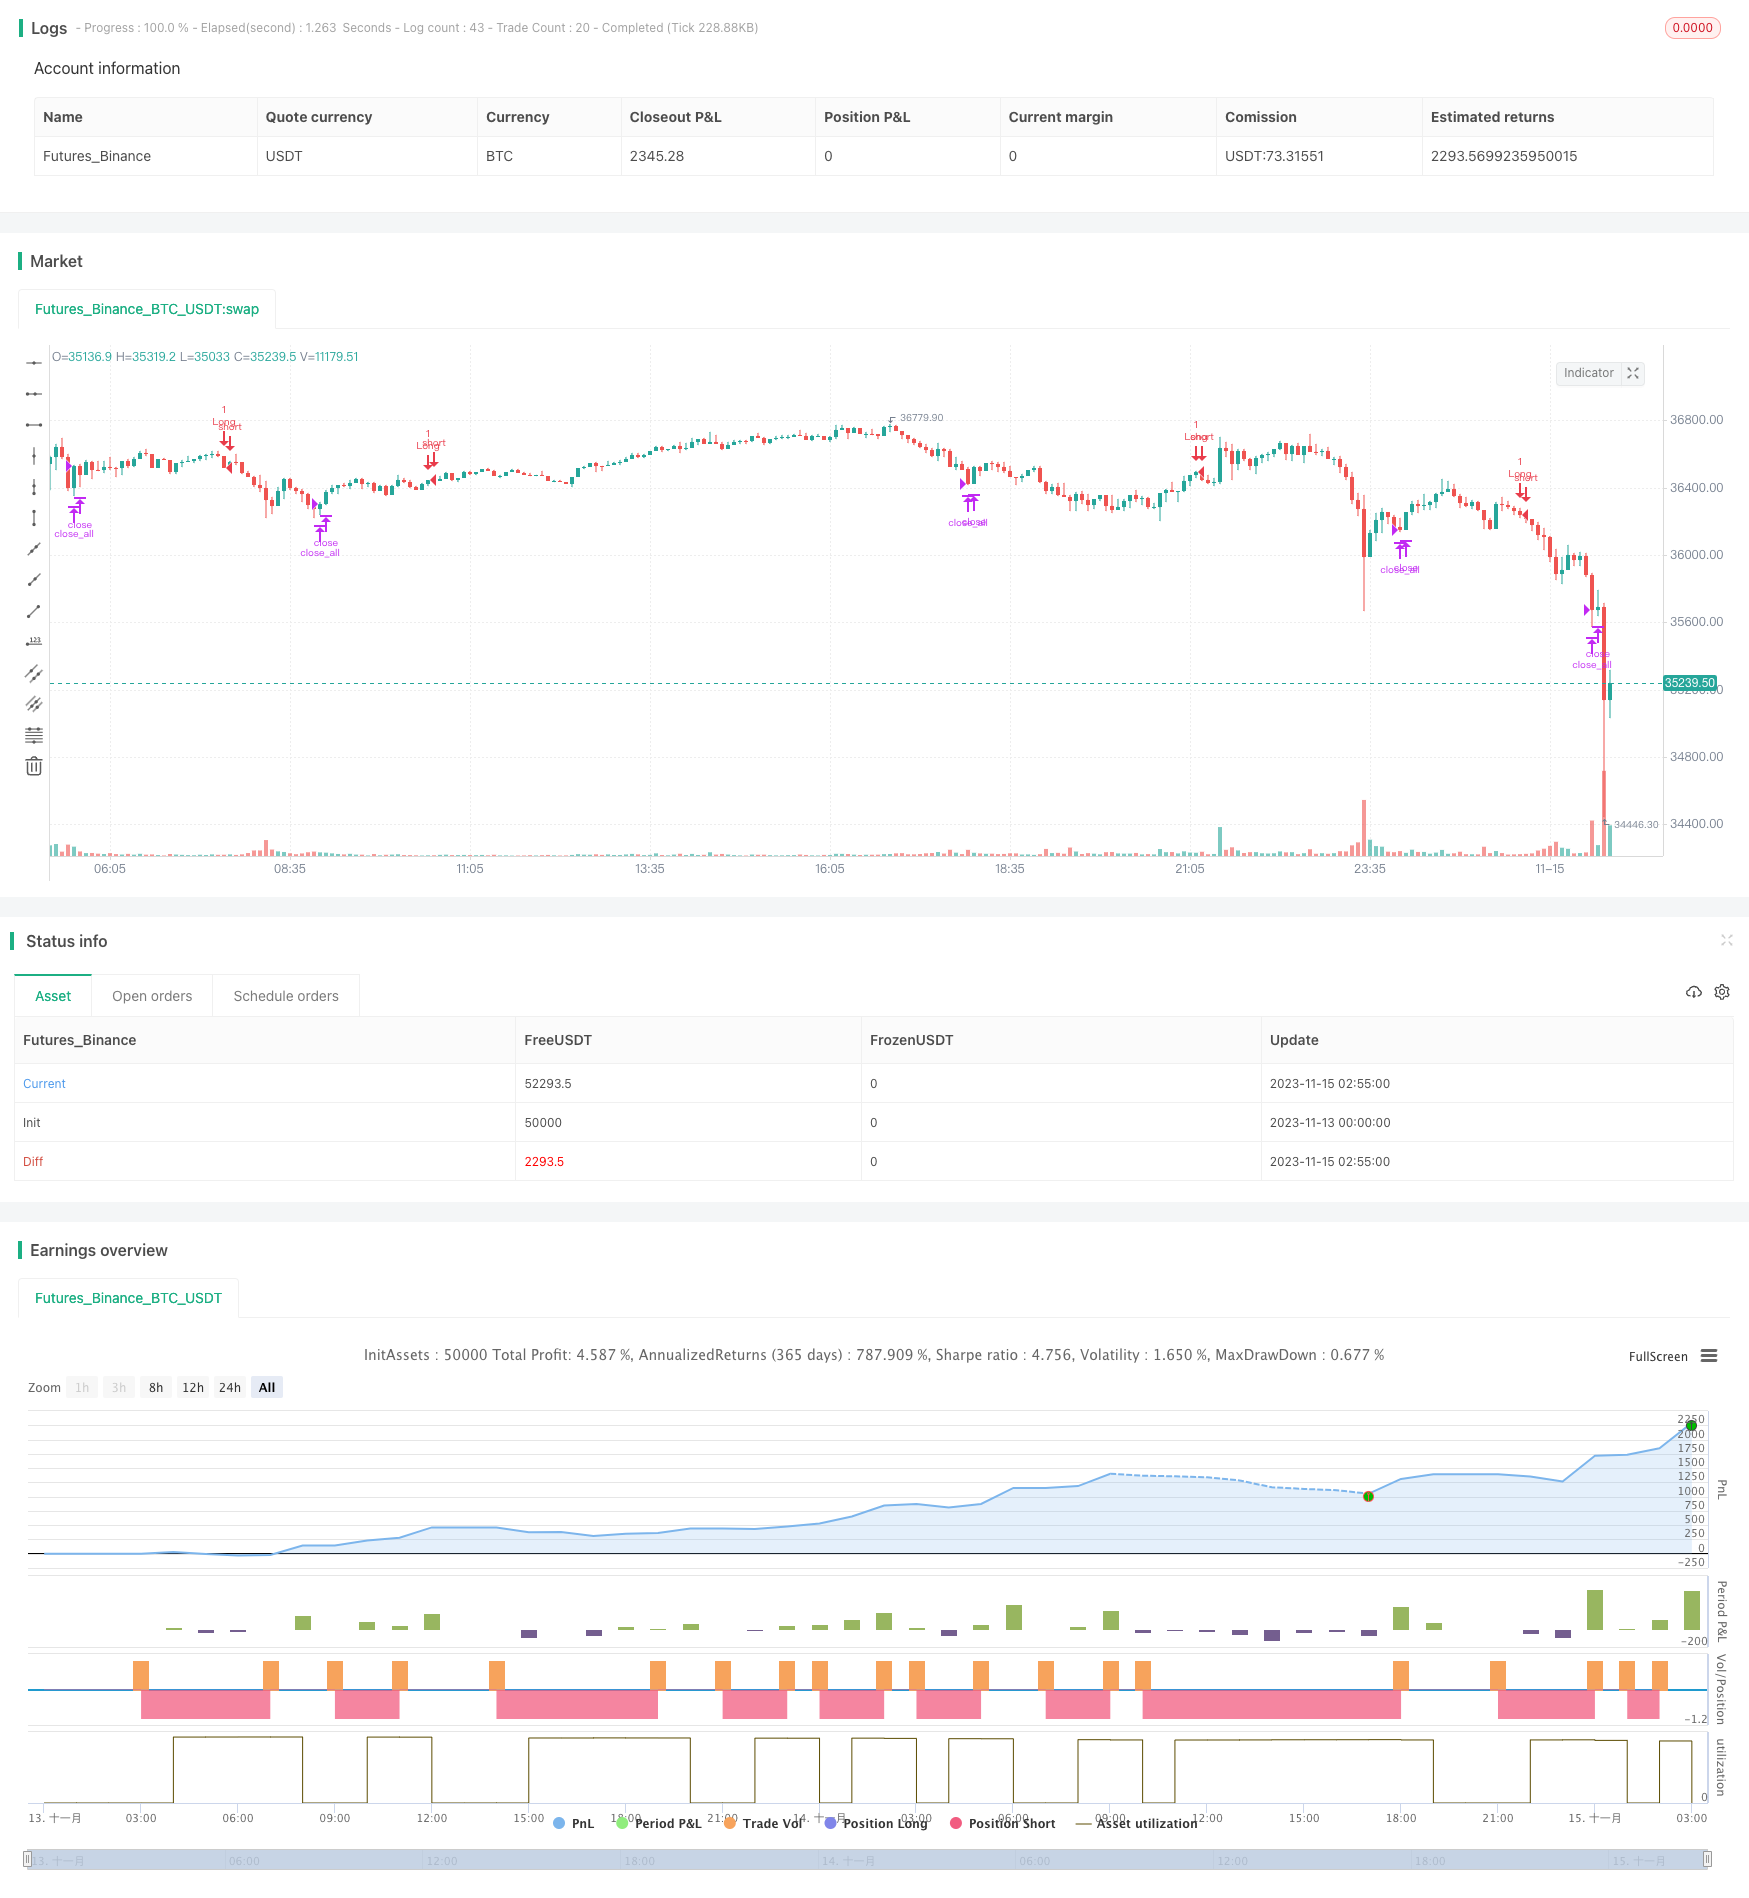
概述
该策略通过计算多种趋势指标,在它们发生反转时进行买入和卖出操作。主要的趋势指标有TDI、TCF、TTF和TII。策略会在配置中选择使用哪一个指标来产生交易信号。
策略原理
- ### TDI指标
TDI指标基于价格的变化 momentum 来计算。通过 summing 和 smoothing 技术构建。当 TDI 方向指标上穿 TDI 曲线时做多,下穿时清仓。
- ### TCF指标
TCF指标计算价格的正变化和负变化,来判断多头和空头的力量。当正变化力量大于负变化力量时做多,否则清仓。
- ### TTF指标
TTF指标通过比较高点和低点的力量来判断趋势。做多的信号是 TTF 指标上穿 100, 反之则清仓。
- ### TII指标
TII指标结合了均线和价格区间来判断趋势反转。它同时考虑短期和长期趋势。做多信号是 TII 指标上穿 80,清仓是下穿 80。
进入做多和平仓的 logic 根据配置的指标来选择合适的交易信号。
策略优势
该策略融合了多种常用的趋势交易指标,可以灵活适应市场环境。具体优势有:
- 利用趋势反转信号,可以及时捕捉趋势转变机会
- 配置不同指标,可以针对性优化
- 丰富的指标组合,可以组合使用来确认信号
策略风险
该策略主要面临以下风险:
- 趋势指标产生的交易信号可能出现误报导致亏损
- 单一指标无法完全判断趋势,容易受到市场噪音的影响
- 配置错误的指标参数和交易参数可能导致曲解市场,产生错误交易
可以采取以下方法降低风险:
- 优化指标参数,找到最佳参数组合
- 组合多个指标信号进行交易,提高信号质量
- 调整仓位管理策略,控制单笔损失
策略优化方向
该策略可以从以下几个方面进行优化:
- 测试不同市场周期的最优指标和参数组合
- 增加或删减指标,找到最优指标组合
- 对交易信号进行过滤,去除误报信号
- 优化仓位管理策略,比如可变仓位,跟踪止损等
- 增加机器学习评分指标,辅助判断信号质量
总结
该策略结合多种趋势反转指标的优势,通过配置指标和参数进行优化,可以适应不同市场环境,在趋势反转点进行操作。关键是找到最优参数和指标组合,同时控制风险。通过持续优化和验证,可以构建稳定具有 alpha 的策略。
策略源码
/*backtest
start: 2023-11-13 00:00:00
end: 2023-11-15 03:00:00
period: 5m
basePeriod: 1m
exchanges: [{"eid":"Futures_Binance","currency":"BTC_USDT"}]
*/

//@version=4
//
// This source code is subject to the terms of the Mozilla Public License 2.0 at https://mozilla.org/MPL/2.0/
// © kruskakli
//
// Here is a collection of Trend Indicators as defined by M.H Pee and presented
// in various articles of the "STOCKS & COMMODITIES Magazine"
//
// The actual implementation of the indicators here are made by: everget
//
// I have gather them here so that they easily can be tested.
//
// My own test was made using 15 companies from the OMXS30 list
// during the time period of 2016-2018, and I only went LONG.
//
// The result was as follows:
//
//        Average    Std.Dev
//        profit
//  TDI    3.04%      5.97
//  TTF    1.22%.     5.73
//  TII    1.07%      6.2
//  TCF    0.32%      2.68
//
strategy("M.H Pee indicators", overlay=true)


use = input(defval="TDI", title="Use Indicator", type=input.string,
             options=["TDI","TCF","TTF","TII"])

src = close


//
// TDI
//
length = input(title="Length", type=input.integer, defval=20)
mom = change(close, length)
tdi = abs(sum(mom, length)) - sum(abs(mom), length * 2) + sum(abs(mom), length)
// Direction Indicator
tdiDirection = sum(mom, length)
tdiLong = crossover(tdiDirection, tdi)
tdiXLong = crossunder(tdiDirection, tdi)

//
// TCF
//
tcflength = input(title="Length", type=input.integer, defval=35)

plusChange(src) =>
    change_1 = change(src)
    change(src) > 0 ? change_1 : 0.0
minusChange(src) =>
    change_1 = change(src)
    change(src) > 0 ? 0.0 : -change_1

plusCF = 0.0
plusChange__1 = plusChange(src)
plusCF := plusChange(src) == 0 ? 0.0 : plusChange__1 + nz(plusCF[1])

minusCF = 0.0
minusChange__1 = minusChange(src)
minusCF := minusChange(src) == 0 ? 0.0 : minusChange__1 + nz(minusCF[1])

plusTCF = sum(plusChange(src) - minusCF, tcflength)
minusTCF = sum(minusChange(src) - plusCF, tcflength)

tcfLong = plusTCF > 0
tcfXLong = plusTCF < 0

//
// TTF
//
ttflength = input(title="Lookback Length", type=input.integer, defval=15)

hh = highest(length)
ll = lowest(length)

buyPower = hh - nz(ll[length])
sellPower = nz(hh[length]) - ll

ttf = 200 * (buyPower - sellPower) / (buyPower + sellPower)

ttfLong = crossover(ttf, 100)
ttfXLong = crossunder(ttf, -100)

//
// TII
//
majorLength = input(title="Major Length", type=input.integer, defval=60)
minorLength = input(title="Minor Length", type=input.integer, defval=30)
upperLevel = input(title="Upper Level", type=input.integer, defval=80)
lowerLevel = input(title="Lower Level", type=input.integer, defval=20)

sma = sma(src, majorLength)

positiveSum = 0.0
negativeSum = 0.0

for i = 0 to minorLength - 1 by 1
    price = nz(src[i])
    avg = nz(sma[i])
    positiveSum := positiveSum + (price > avg ? price - avg : 0)
    negativeSum := negativeSum + (price > avg ? 0 : avg - price)
    negativeSum

tii = 100 * positiveSum / (positiveSum + negativeSum)

tiiLong = crossover(tii, 80)
tiiXLong = crossunder(tii,80)

//
// LOGIC
//
enterLong = (use == "TDI" and tdiLong) or (use == "TCF" and tcfLong) or (use == "TTF" and ttfLong) or (use == "TII" and tiiLong)
exitLong = (use == "TDI" and tdiXLong) or (use == "TCF" and tcfXLong) or (use == "TTF" and ttfXLong) or (use == "TII" and tiiXLong)


// Time range for Back Testing
btStartYear  = input(title="Back Testing Start Year",  type=input.integer, defval=2016)
btStartMonth = input(title="Back Testing Start Month", type=input.integer, defval=1)
btStartDay   = input(title="Back Testing Start Day",   type=input.integer, defval=1)
startTime = timestamp(btStartYear, btStartMonth, btStartDay, 0, 0)

btStopYear  = input(title="Back Testing Stop Year",  type=input.integer, defval=2028)
btStopMonth = input(title="Back Testing Stop Month", type=input.integer, defval=12)
btStopDay   = input(title="Back Testing Stop Day",   type=input.integer, defval=31)
stopTime  = timestamp(btStopYear, btStopMonth, btStopDay, 0, 0)

window() => time >= startTime and time <= stopTime ? true : false


riskPerc     = input(title="Max Position  %", type=input.float, defval=20, step=0.5)
maxLossPerc  = input(title="Max Loss Risk %", type=input.float, defval=5, step=0.25)

// Average True Range (ATR) measures market volatility.
// We use it for calculating position sizes.
atrLen   = input(title="ATR Length", type=input.integer, defval=14)
stopOffset = input(title="Stop Offset", type=input.float, defval=1.5, step=0.25)
limitOffset = input(title="Limit Offset", type=input.float, defval=1.0, step=0.25)
atrValue = atr(atrLen)


// Calculate position size
maxPos = floor((strategy.equity * (riskPerc/100)) / src)
// The position sizing algorithm is based on two parts:
// a certain percentage of the strategy's equity and
// the ATR in currency value.
riskEquity  = (riskPerc / 100) * strategy.equity
// Translate the ATR into the instrument's currency value.
atrCurrency = (atrValue * syminfo.pointvalue)
posSize0    = min(floor(riskEquity / atrCurrency), maxPos)
posSize     = posSize0 < 1 ? 1 : posSize0

if (window())
    strategy.entry("Long", long=true, qty=posSize0, when=enterLong)
    strategy.close_all(when=exitLong)