概述
该策略是一个利用动量指标RSI结合布林带指标BB的二进制期权突破交易策略。在时间上,利用TTM指标判断市场是否处于盘整状态,从而提高入场的可靠性。
策略原理
策略的基本逻辑是在TTM指标集合形成突破的基础上,结合布林带和RSI指标判定价格的突破方向。具体来说,策略使用20周期的BB和30周期的RSI。当市场突破缩量后,在RSI处于一定波动区间(30-70)且BB有较大突破(0.15倍波动范围)的情况下确定开仓方向。此外,策略还检查开仓前一根K线的开仓方向,以避免不必要的反复开仓。
优势分析
该策略主要有以下几点优势:
利用TTM指标判断市场的交易状态,避免在盘整市场无意义的交易。 TTMS指标的集合压缩、膨胀能更好的判断主要趋势方向,为开仓提供参考。
RSI与BB的结合使用,可以使得开仓更加可靠。RSI指标判断价格有无超买超卖现象;而BB指标判断价格是否已经发生较大突破。两者结合使用,使得策略可以在较强势的方向性行情中获利。
策略逻辑考虑了一定的优化,例如避免反复开仓等。这可以一定程度上减少不必要的盈亏来回切换。
风险分析
该策略主要存在以下风险:
突破失败风险。当TTM指标判断趋势准确性不高时,RSI和BB依然可能发生错误突破。此时策略根据指标清单开仓,最终可能被套。为控制该风险,可以考虑降低仓位规模。
市场震荡时,容易形成亏损。当市场处于震荡状态,TTM指标的表现并不理想。RSI和BB指标也可能出现多次错误信号。这时就很容极易形成损失。为控制该风险,应避免在明显震荡市场使用该策略。
优化方向
该策略可以从以下几个方面进行优化:
优化TTM指标参数,调整指标的长度和因子。这可以提高TTM指标对盘整和突破的判断。
优化RSI和BB的参数。适当缩短周期数,可能获取更及时更精确的突破信号。同时BB的通道带宽度也可以测试不同的取值。
增加止损逻辑。该策略没有设置止损位,为防止单笔亏损过大,可以考虑加上移动止损或期望止损。
可以测试不同的品种参数。当前策略是在1分钟线上运行,对于其他品种参数(如5分钟),指标参数可以重新测试优化,获取更好的参数组合。
总结
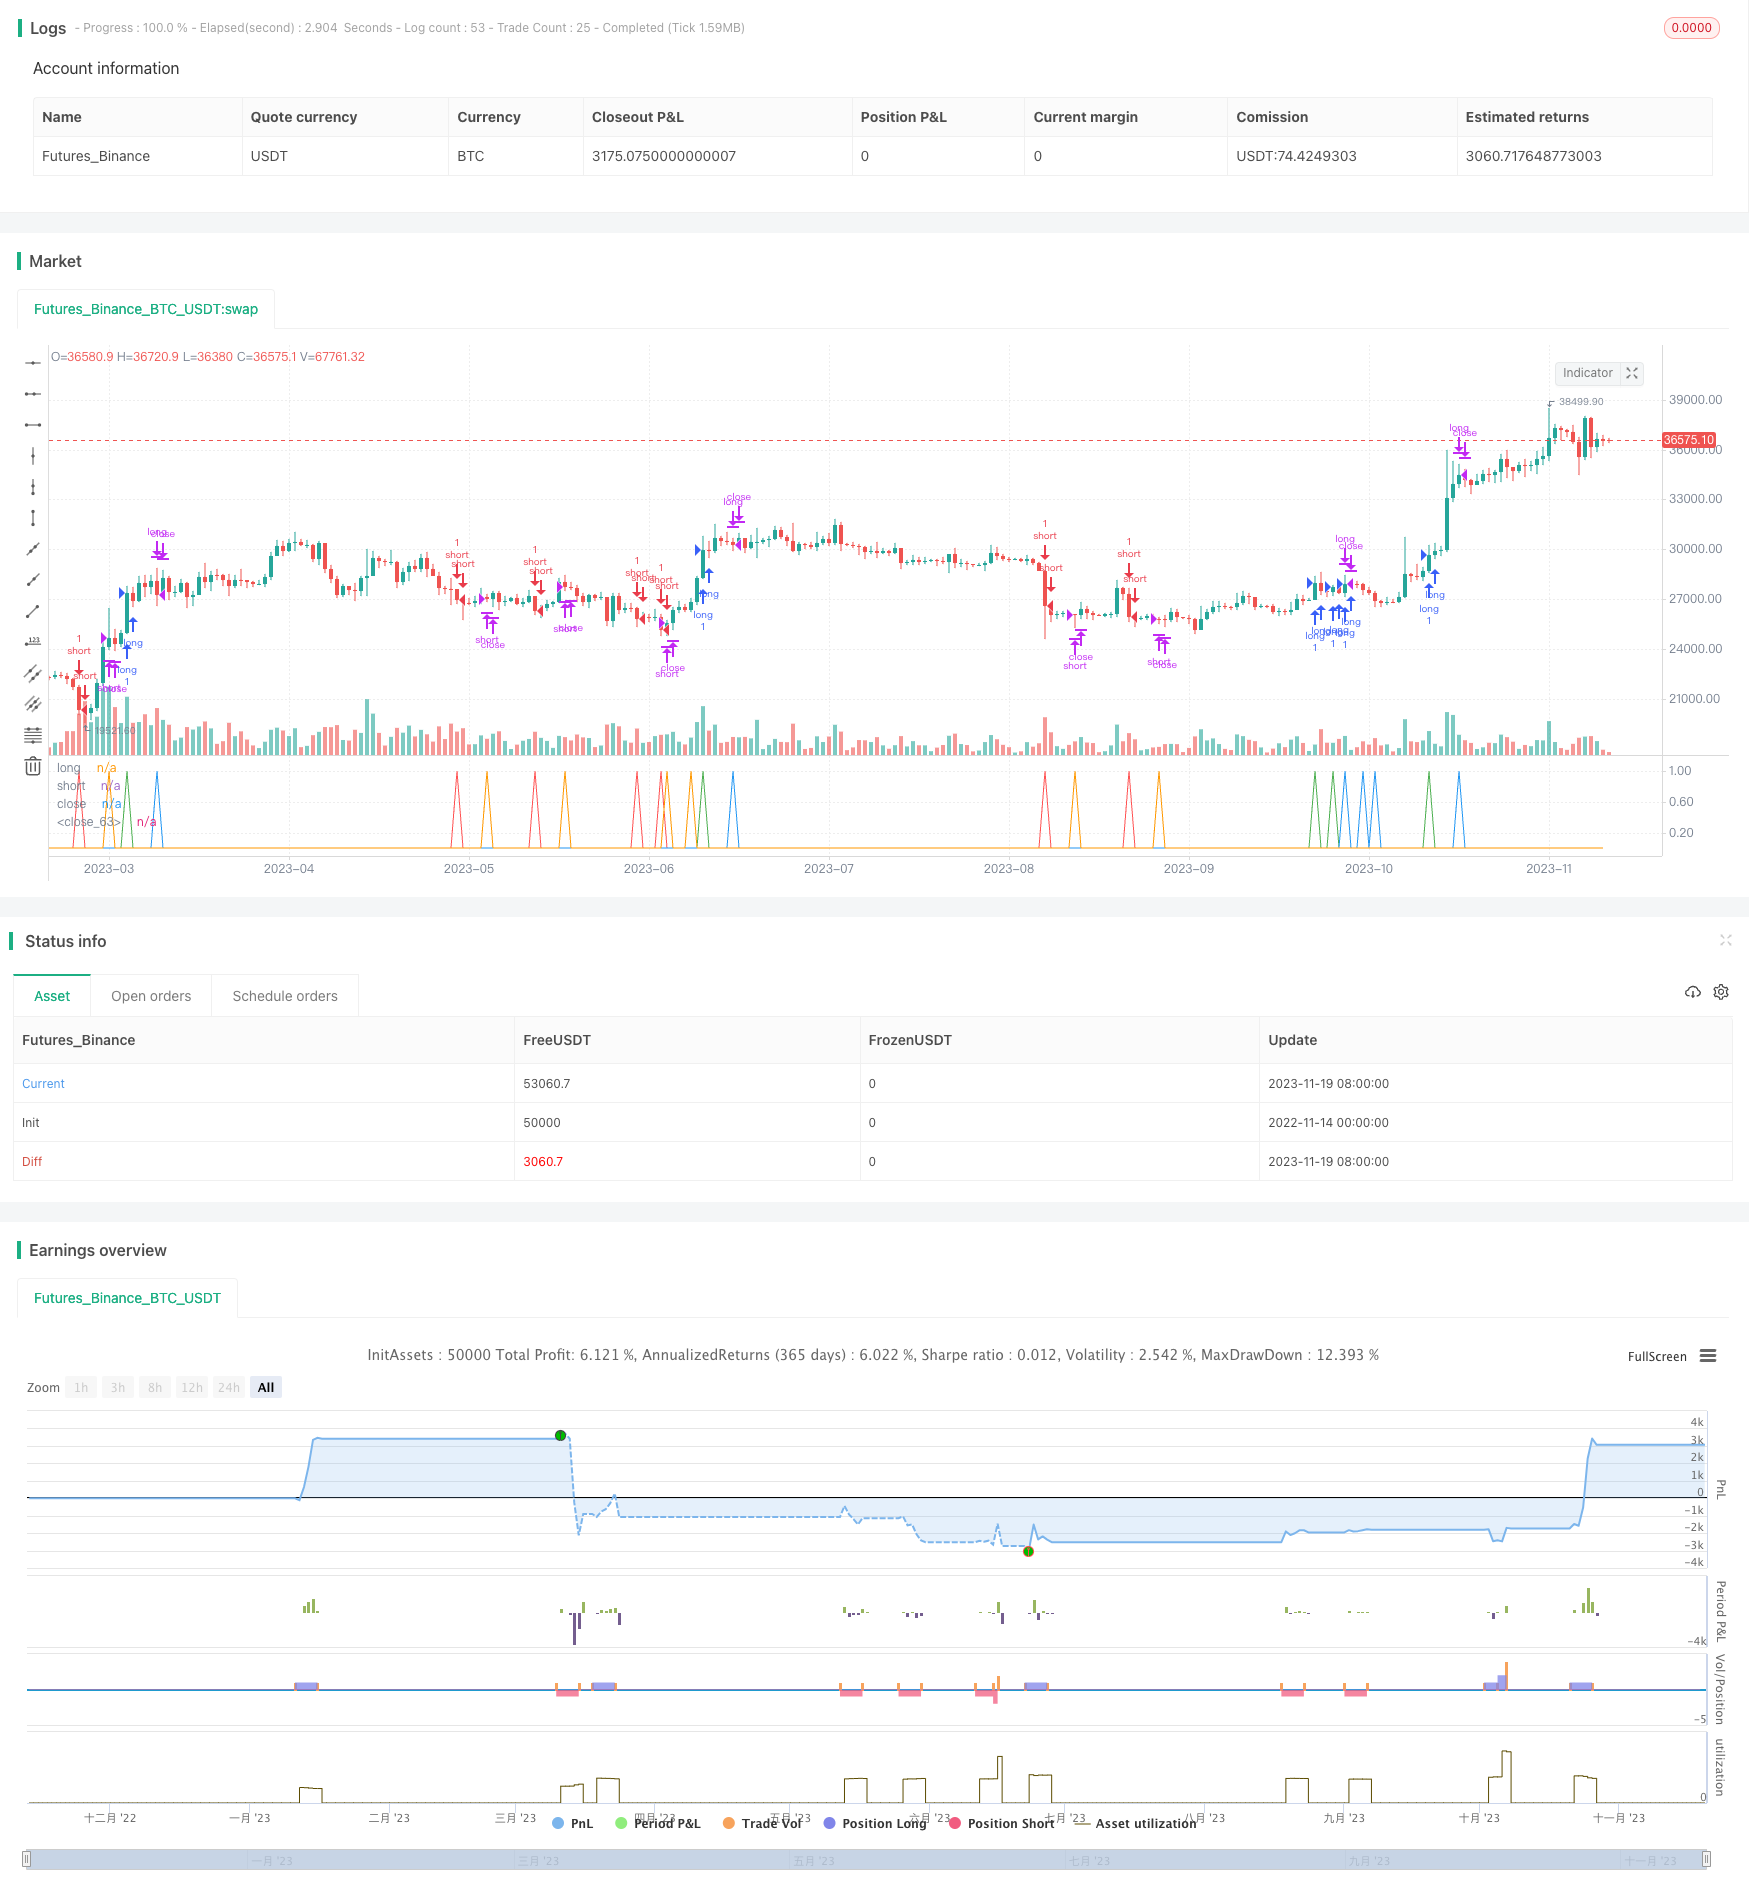
该策略是一个利用TTM判断趋势准确性,结合RSI和BB判定突破方向的二进制期权策略。相比简单的突破策略,其入场时机和指标参数优化都更有优势,可以提高盈利概率。但该策略也存在一定的失败风险和震荡市的适应性问题。这需要我们在使用中,调整仓位规模并避免在震荡市使用。通过进一步的参数和止损优化,该策略可以成为一个可靠的期权交易策略。
/*backtest
start: 2022-11-14 00:00:00
end: 2023-11-20 00:00:00
period: 1d
basePeriod: 1h
exchanges: [{"eid":"Futures_Binance","currency":"BTC_USDT"}]
*/

//@version=4
strategy (title="EA_Binary Option Spfrat Strategy", shorttitle="Spyfrate_Binary Option 5min", overlay=false, pyramiding=1999, initial_capital=60000, currency=currency.USD)

// TTM Squeeze code
lengthttm = input(title="Length",  defval=20, minval=0)
bband(lengthttm, mult) =>
	sma(close, lengthttm) + mult * stdev(close, lengthttm)
keltner(length, mult) =>
	ema(close, lengthttm) + mult * ema(tr, lengthttm)

e1 = (highest(high, lengthttm) + lowest(low, lengthttm)) / 2 + sma(close, lengthttm)
osc = linreg(close - e1 / 2, lengthttm, 0)
diff = bband(lengthttm, 2) - keltner(lengthttm, 1)
osc_color = osc[1] < osc[0] ? osc[0] >= 0 ? #00ffff : #cc00cc : osc[0] >= 0 ? #009b9b : #ff9bff
mid_color = diff >= 0 ? green : red
conso = diff >= 0?1:0

//plot(osc, color=osc_color, style=histogram, linewidth=2)
//plot(0, color=mid_color, style=circles, linewidth=3)

// BB Init
source = close
length = input(50, minval=1)
mult = input(0.2, title="Mult Factor", minval=0.001, maxval=50)
alertLevel=input(0.1)
impulseLevel=input(0.75)
showRange = input(false, type=bool)

//RSI CODE
src = close,
up = rma(max(change(src), 0), 30)
down = rma(-min(change(src), 0), 30)
rsi = down == 0 ? 100 : up == 0 ? 0 : 100 - (100 / (1 + up / down))

//BB CODE
basis = sma(source, length)
dev = mult * stdev(source, length)
upper = basis + dev
lower = basis - dev
bbr = source>upper?(((source-upper)/(upper-lower))/10): source<lower?(((source-lower)/(upper-lower))/10) : 0.05
bbi = bbr - nz(bbr[1])
//Rule
long1 = rsi>50.5 and rsi<70 and  bbi>0.15  and osc>0.00100 and conso>0
short1 = rsi<49.5 and rsi>30 and  bbi<-0.15 and osc<-0.00100 and conso>0
//
long = long1[1] == 0 and long1 == 1
short = short1[1] == 0 and short1 == 1
longclose = long[5] == 1
shortclose = short[5] == 1

//Alert

strategy.entry("short", strategy.short, when=short)
strategy.entry("long", strategy.long, when=long)
plot(long,"long",color=green,linewidth=1)
plot(short,"short",color=red,linewidth=1)
strategy.close("long",when=longclose)
strategy.close("short",when=shortclose)

//strategy.exit(id="long",qty = 100000,when=longclose)
//strategy.exit(id="short",qty = 100000,when=shortclose)
plot(longclose,"close",color=blue,linewidth=1)
plot(shortclose,"close",color=orange,linewidth=1)
//strategy.exit(id="Stop", profit = 20, loss = 100)