Dual Indicator Oscillation Strategy

Overview
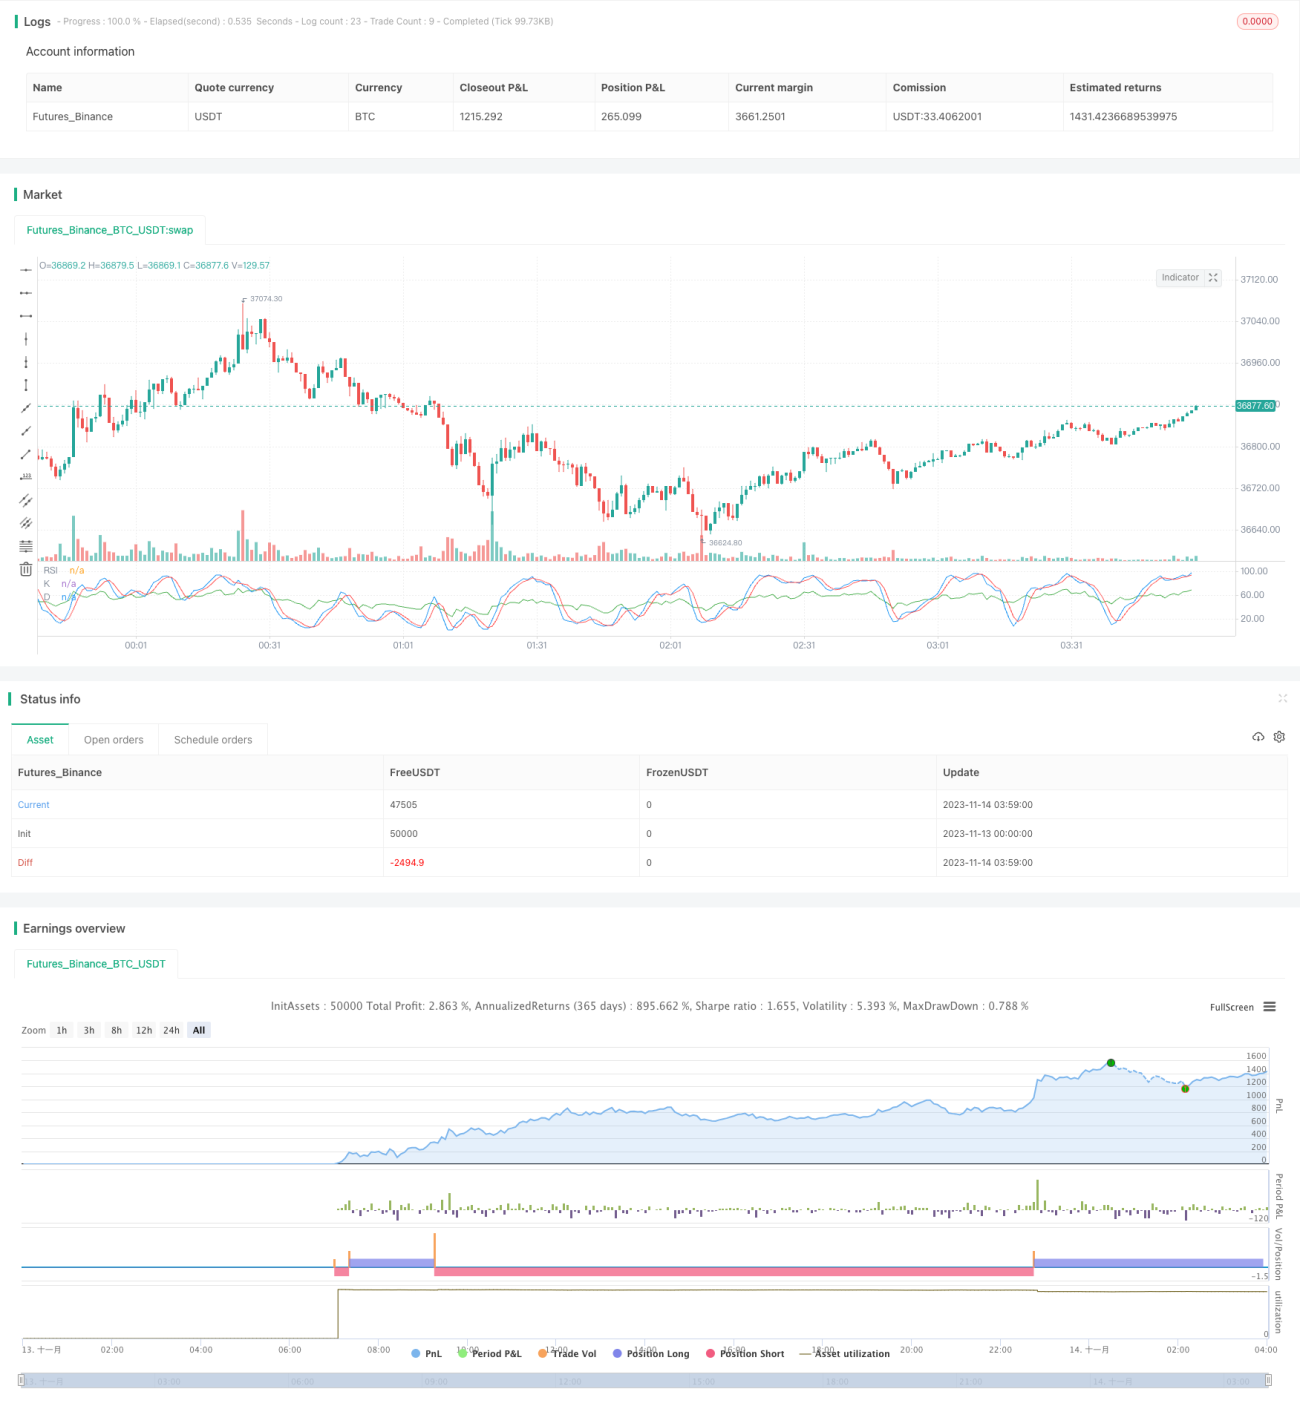
This strategy combines the stochastic indicator RSI and Stochastic Oscillator with specified parameters to make buy and sell operations within a certain oscillation range.
Principles
The code first defines parameters like K value, D value and SD value of the Stochastic Oscillator, and cycle parameters of the RSI indicator. After calculating the values of Stochastic Oscillator and RSI for each candlestick, if RSI is lower than the lower limit 20 and K value is also lower than 20, it is an oversold signal for going short; if RSI is higher than the upper limit 80 and K value is also higher than 80, it is an overbought signal for going long. The dual indicator confirmation can filter out some false signals. It also sets stop loss and take profit conditions.
Advantage Analysis
This dual indicator filtering strategy can effectively reduce unnecessary trades caused by whipsaws in a common Stochastic strategy. Combining with the trend indicator RSI also avoids blind trading without a clear trend. So this combined indicator strategy can improve signal quality, reduce false signals, and better control risks.
Risk Analysis
The biggest risk of this strategy is that the specified parameters may not be suitable for all varieties and time periods. For example, the parameters of RSI and Stochastic need to be adjusted in subdivided time cycles. In addition, Stochastic-type strategies will incur greater losses when trends change dramatically. Therefore, this strategy is more suitable for range-bound oscillating market environments.
Optimization Recommendations
More combinations of indicators can be tested, such as combining MACD with Stochastic or RSI to form multiple indicator filtering. The specific parameter values of RSI and Stochastic can be adjusted to find the optimal parameter combination. The stop loss and take profit range can be adjusted dynamically based on fluctuations over the recent N days. Through parameter optimization and indicator optimization, the strategy performance can be continuously improved.
Conclusion
This strategy integrates the stochastic indicator Stochastic and trend strength indicator RSI for dual indicator filtering, which can effectively identify overbought and oversold situations suitable for range-bound oscillation markets, performing better than single Stochastic indicator strategies. There is further room for performance improvement through parameter and indicator combination optimization.
- 1