Momentum Oscillation Trading Strategy

Overview
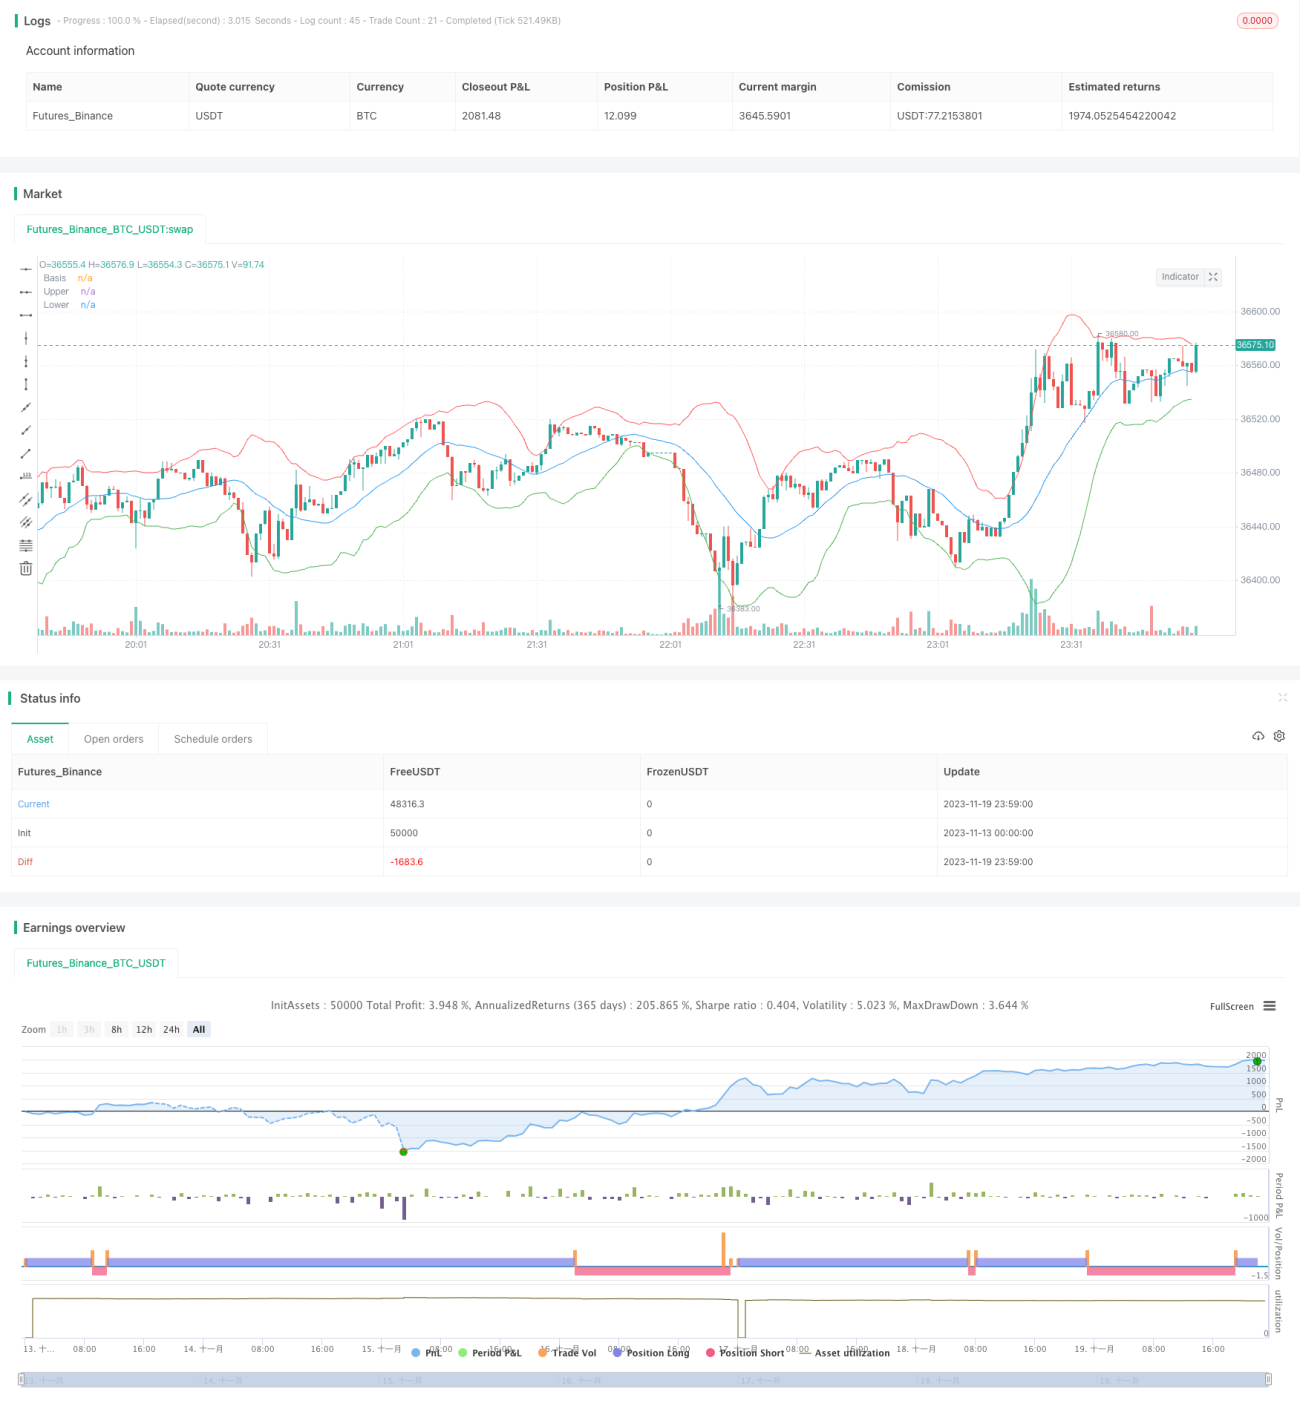
This strategy is based on the Bollinger Bands indicator, combined with momentum indicators to implement a combination trading strategy of Bollinger Bands reversion and momentum breakout. It goes long when the price breaks through the middle line of the Bollinger Bands from below and goes short when the price breaks through the middle line from above. It also tracks stop loss and take profit based on entry price to close positions when target risk-reward ratio is met.
Strategy Logic
The strategy uses Bollinger Bands middle line sma as the moving average indicator, and dynamically adjusts the band width through param mult*stdev. When price breaks through the middle line from below, it indicates upward momentum is gained and thus goes long. When price breaks down through the middle line from above, it shows downward momentum is gained and thus goes short. After entering long/short positions, stop loss and take profit parameters are set to track profits and control risks.
Specifically, Bollinger Bands are calculated with two parameters - length and mult. Length determines the period of the middle line and mult decides the band width. enterLong and enterShort judge the breakout timing. exitLong and exitShort calculate stop loss and take profit prices based on entry price and target percentage.
Advantages
This strategy combines reversion to the mean and momentum, which enables it to capture major trends early on. Compared to simply tracking moving averages, the added momentum judgment based on Bollinger Bands width can filter out some false breakouts. Stop loss and take profit are set directly based on entry price without manual intervention.
Risks
- Lagging in Bollinger Bands fitting prices, may miss some moves
- Stop loss set too wide may increase loss risks
- Short signals in bull market may not turn out well
Parameters like periods, band width and stop loss range can be optimized to make the strategy adaptable to different market conditions.
Enhancement
- Add trading volume or volatility to avoid low volume false breakouts
- Param grid search to optimize periods, width coefficient and stop loss percentage
- Go only long or short based on market regime
- Add Machine Learning model to determine trend direction
Conclusion
This strategy combines the strengths of Bollinger Bands reversion and momentum, which enables it to capture some trends early on. Through parameter tuning it can adapt to different market stages. The direct stop loss/take profit calculation reduces manual intervention. There is still room for improvement, e.g. incorporating more auxiliary indicators. These will be incrementally enhanced in further research and optimization.
- 1