Multi Timeframe Dynamic Backtesting Strategy

Overview
This strategy employs a multi timeframe dynamic backtesting mechanism to determine price trends by comparing the highest and lowest prices across different time periods, thereby achieving low-risk arbitrage.
Strategy Logic
The strategy retrieves the highest price (nhigh) and lowest price (nlow) across different timeframes by calling the custom function f_get_htfHighLow. Specifically, based on user-defined inputs like time period resolution, time period multiplier HTFMultiplier, backtesting parameters lookahead and gaps, and offset, it invokes the security function to obtain the highest and lowest prices over different timeframes.
For example, an offset of 0 retrieves the highest and lowest prices of the current bar, while an offset of 1 retrieves those prices from the previous bar. By comparing price changes between bars, trend direction is determined.
If both highest and lowest prices rise, a bullish trend is identified. If both prices fall, a bearish trend is seen. Longing or shorting positions are taken based on the trend direction to implement arbitrage trades.
Advantages
- Enhanced accuracy through multi timeframe analysis
- Avoids repainting via dynamic backtesting
- Flexible parameters accommodate market changes
- Reduced risk with positions only in clear trends
Risks
- Multi timeframe misjudgements
- Repainting from improper backtesting parameters
- High costs and slippage from excessive trades
Solutions:
- Optimize time periods for accuracy
- Strictly test parameters to prevent repainting
- Moderate entry conditions to control frequency
Enhancement Opportunities
- Add ML to leverage AI for trends
- Incorporate volatility filters for dynamic position sizing
- Introduce stops to effectively limit losses
Conclusion
The strategy logic is clear, using multi timeframe dynamic backtesting to determine trends and minimize human bias. With refinement through parameter optimization and feature expansion, it demonstrates significant potential for improved stability and profitability worthy of further research and tracking.
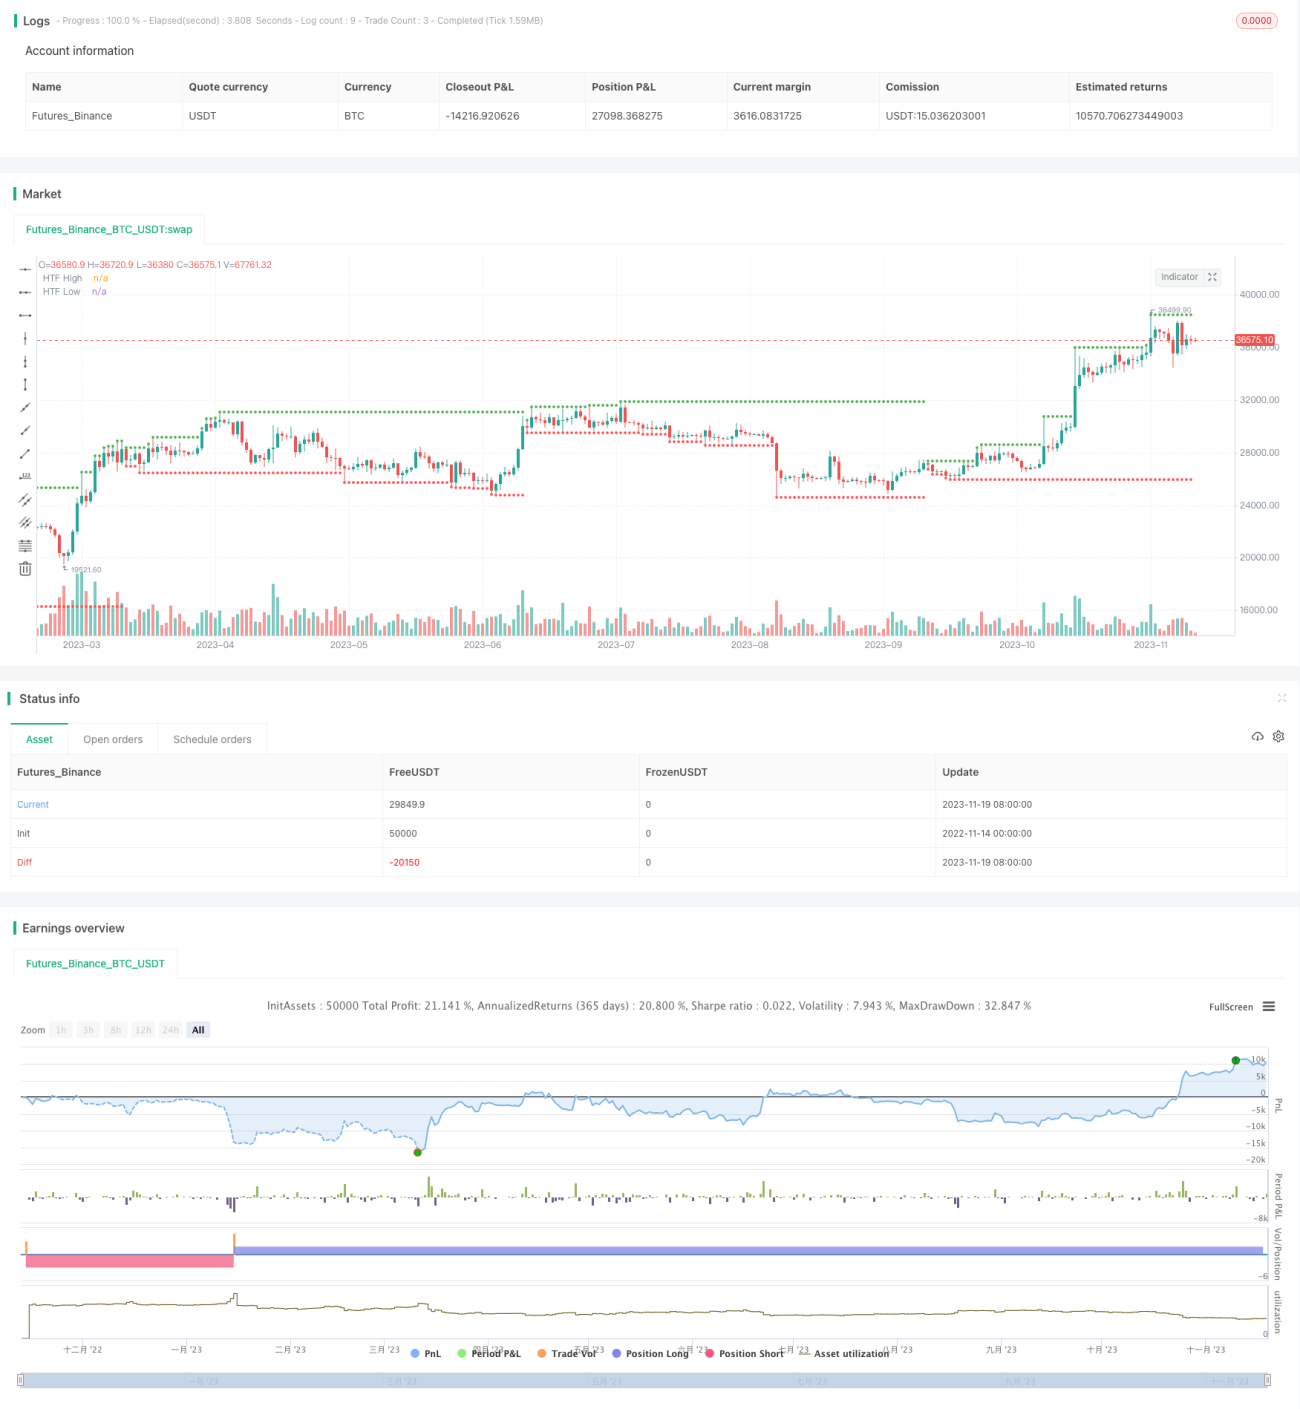
/*backtest
start: 2022-11-14 00:00:00
end: 2023-11-20 00:00:00
period: 1d
basePeriod: 1h
exchanges: [{"eid":"Futures_Binance","currency":"BTC_USDT"}]
*/

// This source code is subject to the terms of the Mozilla Public License 2.0 at https://mozilla.org/MPL/2.0/
// © HeWhoMustNotBeNamed

//@version=4- 1